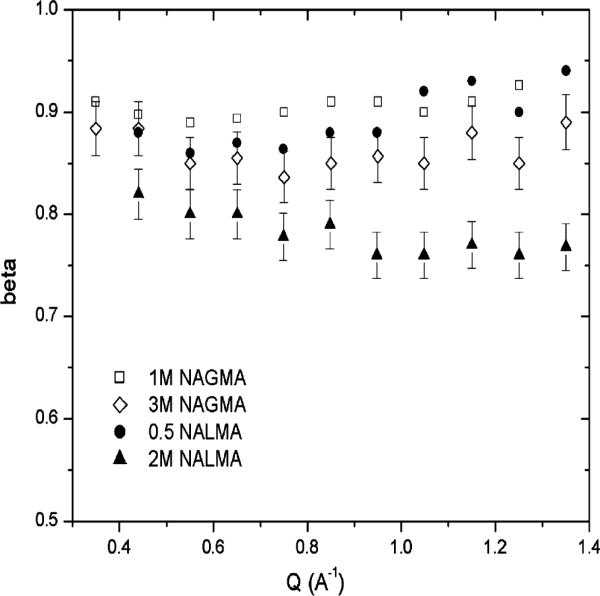
Figure 6.

Stretched exponential parameter β, from the fit to experiment at different Q values for NAGMA and NALMA as a function of concentration. We show the error bar in regard to the fit for the highest concentration used for NAGMA and NALMA and similar error bars were found for the other concentrations as well.
