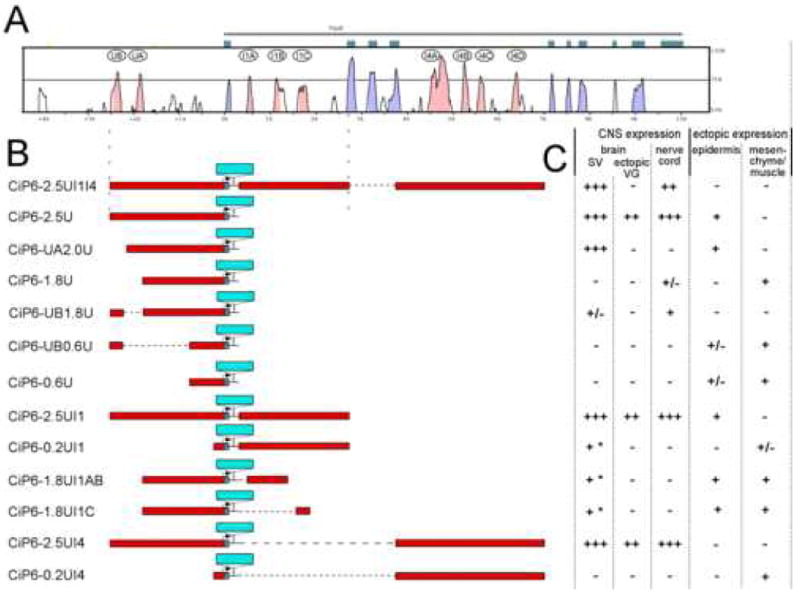
Fig. 2. Ciona sequence alignment, transgene diagrams and scoring.

(A) mVista sequence alignment plot between C. intestinalis and C. savignyi, with CiPax6 exons shown as blue-green boxes. Curve represents levels of sequence identity in a 50 bp window. Blue-shaded peaks are in exons while pink-shaded peaks are in non-coding sequence. Major conserved non-coding sequences (CNSs) are identified by letters in ovals. (B) Diagrams of transgene constructs. Non-coding sequence is represented by red bars aligned with corresponding sequence in Vista plot above. LacZ reporter gene insertion is represented by a blue bar. Dotted horizontal lines indicate sequences not in the transgene. (In these cases the cloned sequences are connected to each other with short linkers.) (C) Scoring chart for expression driven by each transgene in C. intestinalis embryos at mid-late tailbud stages. Number of “+” symbols denotes relative intensity and penetrance of lacZ expression. “-” indicates lack of expression. “+/-” indicates that expression is present in some embryos at a low level. * refers to limited expression in central sensory vesicle only.
