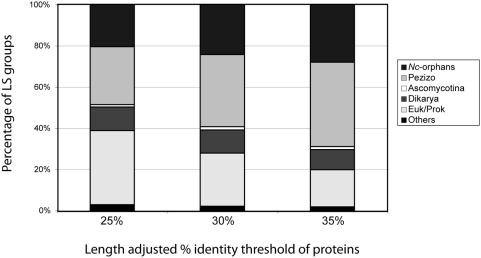
Figure 2. Proportion of lineage specificity (LS) groups in relation to threshold values for length-adjusted percent protein identity.
The 9,127 N. crassa gene set was classified into five LS groups according to presence/absence of homologs in defined taxonomical units at the given percent protein identity threshold level (25%, 30% or 35%). From the top, the proportion of genes in N. crassa-orphan, Pezizo-specific, Ascomycota-core, Dikarya-core, Euk/Prok-core, and Others LS groups are shown. Note that the number of genes in N. crassa-orphans and Pezizo-specific groups increases and the threshold level rises from 25% to 35%.

