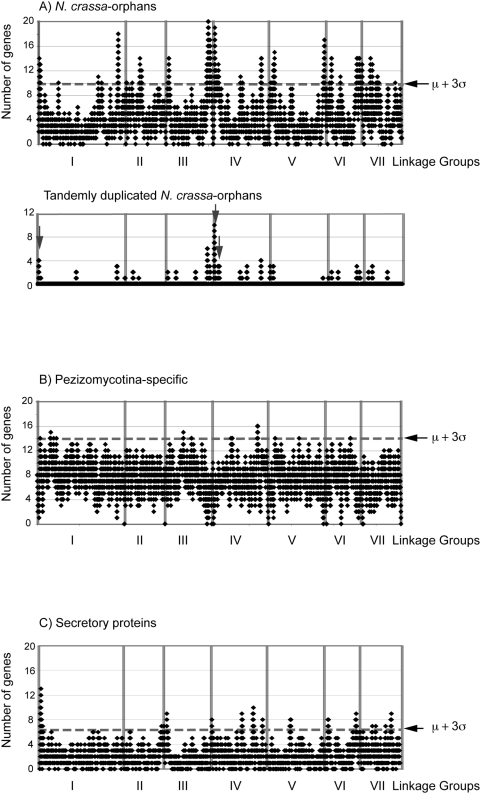
Figure 4. Distribution of A) N. crassa-orphan, B) Pezizomycotina-specific and C) secretory PCGs across the seven chromosomes.
Distribution of these gene sets were evaluated for every 20 PCGs along N. crassa chromosomes I to VII. The chromosomal distribution of tandemly duplicated N. crassa-orphan PCGs is shown at the lower panel in A). The vertical grey arrows indicate clusters of five or more gene paralogs. Boundaries between chromosomes are shown with vertical lines. A mean density+3 standard deviations (p = 0.001) according to binomial distribution is shown with a horizontal black arrow in each panel.

