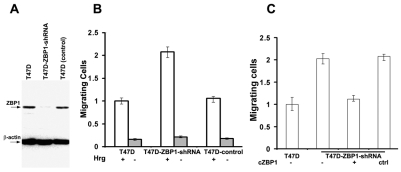
Fig. 4.
Loss of ZBP1 promotes cell migration. (A) Western blots showing ZBP1 knockdown in T47D-ZBP1-shRNA cells. (B) Migration assays were performed in T47D, T47D-ZBP1-shRNA and T47D lentivirus control cell clones. Migration was quantified by visual counting of the total cells on the underside of the filter. The relative numbers of migrating cells from each assay are normalized to the T47D clone and are represented as a fold change to the T47D clone. Data shown in the figure represent the means ± s.e.m. of data from six experiments. (C) Gain of ZBP1 function inhibited cell migration. An expression plasmid for chicken ZBP1 was transfected into T47D-ZBP1-shRNA cells and migration assays were performed. Data shown in the figure represent the means ± s.e.m. of data from four experiments.

