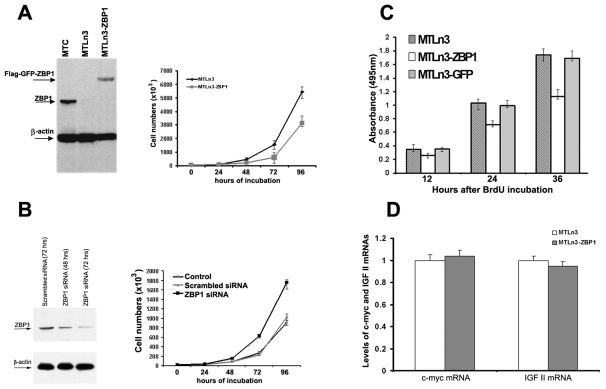
Fig. 5.
Expression of ZBP1 in metastatic cells suppresses cell proliferation. (A, left) Expression of ZBP1 in MTC, MTLn3 and MTLn3-ZBP1 cells. FLAG-ZBP1 is constantly expressed in the stable MTLn3-ZBP1 cell line. The arrows indicate the positions of the detected proteins. (A, right) Growth curve of MTLn3 and MTLn3-ZBP1 cells. Expression of ZBP1 in metastatic MTLn3 cells markedly reduced their proliferation rate. Data shown in the figure represent the means ± s.e.m. of data from three experiments, each with duplicates. (B, left) Western blot analysis was performed to examine ZBP1 and β-actin expression in MTLn3-ZBP1 cells after transfection with scrambled or ZBP1 siRNAs. (B, right) MTLn3-ZBP1 cell numbers were determined at the indicated time points after transfection with scrambled or ZBP1 siRNAs. Knockdown of ZBP1 function in MTLn3-ZBP1 cells increased the number of viable cells. Data shown in the figure represent the means ± s.e.m. of data from four independent experiments. (C) Effect of ZBP1 on proliferation of MTLn3, MTLn3-ZBP1 and MTLn3-GFP cells, assessed by the BrdU-incorporation assay. The absorbance at 495 nm is proportional to the BrdU incorporation and to the number of viable cells in the culture. The experiments were repeated twice, and five wells were used for each individual cell clone. (D) Cytoplasmic levels of Myc, IGF2 and β-actin mRNAs were detected in MTLn3 and MTLn3-ZBP1 cells by RT-PCR analyses. Relative levels of Myc and IGF2 mRNAs are normalized and averaged to β-actin mRNA from three independent experiments.

