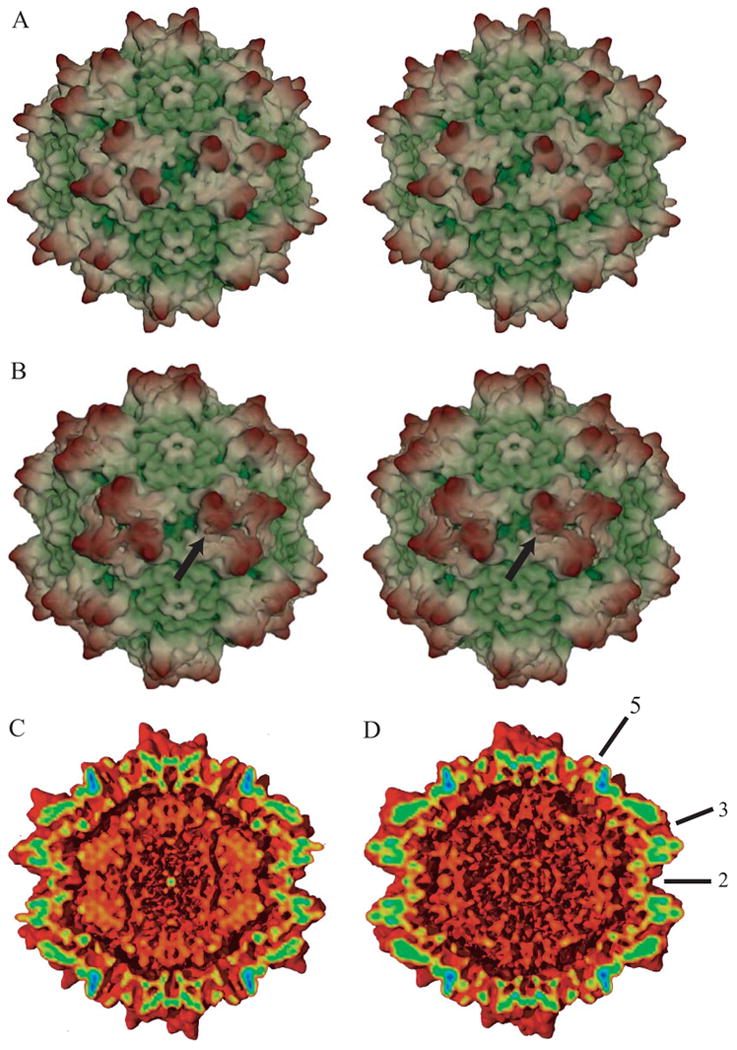
Figure 1.

3-D electron microscope reconstructions of native (A & C) and heparin-complexed AAV-2 (B & D) at 7.8 and 8.3 Ǻ resolution respectively. Panels A & B show stereo pairs of the outer surface, while C & D show cut-aways to reveal the inner surface, all viewed in the same orientation down a 2-fold axis of symmetry. Maps were spherically masked (at 80 & 160 Ǻ) for clarity. (Note that while the particles imaged contained DNA, generally it was not seen above noise levels at these resolutions, because its structure was disordered.) In panels A & B, maps are colored according to distance from the center (from green to yellow to brown). The arrow in panel B points to the general vicinity of the bound receptor. At this contour level (4.4 e.u.), relative to the native particle in panel A, density is added to the lower surface of the 3-fold peak, and connecting density can be seen extending to a neighboring peak. In panels C & D, coloring is by strength of the density, from weakest (2.5 e.u., red) to strongest (25 e.u., blue). Some of the icosahedral symmetry axes are annotated in panel D. The differences between the complexed (D) and native (C) are subtle, and will be best visualized in difference maps in later figures. However, the map of the complex has extra density between the three-fold promixal surface peaks. The point to be emphasized from panels C & D are that the addition of the heparin makes little difference to the capsid protein structure.
