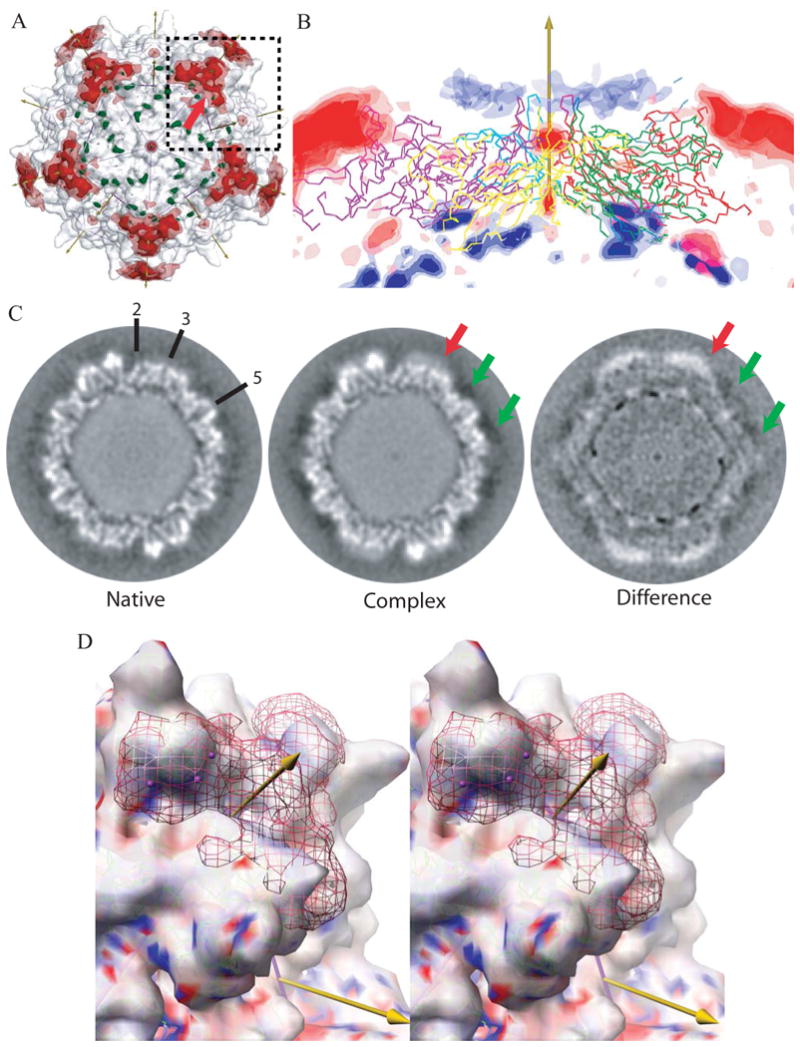
Figure 3. Differences between cryo-EM reconstructions of the heparin-complex and native AAV-2.

(A) Superimposed on the EM reconstruction of the native particle (gray translucent surface) are the positive (red) and negative (green) regions of the difference map. The icosahedral symmetry axes are shown with arrows (the view is down a 5-fold) and surface is divided into 60 equivalent triangular areas. The strongest positive difference densities surrounds each 3-fold axes, rising to 6.9 e.u.. Contouring of the difference density at ±4 e.u. (translucent) and ±5 e.u. (solid surface) shows that these peaks are the most massive.
(B) The difference density is shown in a cross-section with a 5-fold axis vertical. Five symmetry-related capsid proteins are shown in Cα trace. Positive density is red, negative is blue, both contoured at ±3, ±4, and ±5 e.u. The strongest negative peaks (∼-6.0 e.u.) are on the inner capsid surface, 83Å from the virus center at the boundary between protein and DNA. The next strongest negative density forms a ring of peaks at -3 to -4 e.u. surrounding each 5-fold axis. These are comparable with the experimental noise level of ∼3 e.u. (see text) and lie 11 Ǻ from the viral surface. The strong positive density at the top left and right are the 3-fold proximal heparin peaks described in panel A. The next strongest positive peaks are on the 5-fold axes of symmetry where noise levels are expected to be 2.2 × that of general positions, so these peaks are not experimentally significant.
(C) Sections through the cryo-EM reconstructions ∼2.45 Å from a plane containing multiple 2-, 3- and 5-fold axes, some of which are annotated. The grey-scale runs from dark (negative density) to white (positive). The green arrows point to the region where negative peaks (-3 to -4 e.u.) surround the 5-fold axis. At this location, 11 Ǻ from the viral surface, the density in both native and complex is negative, suggestive of experimental error or solvent differences. By contrast, the stronger density, highlighted with a red arrow in panels A & C, is clearly more positive than that in the native and is the site where heparin binds.
(D) Stereoscopic image of the most prominent difference peak. The view is similar to the boxed region in panel A, with a 3-fold axis rotated ∼17° clockwise from vertical and ∼32° forwards. The surface shows the cryo-EM reconstruction of the native virus contoured at 3.1 e.u. and colored according to the electrostatic potential of the underlying crystallographic structure (ball-&-stick, green carbons). The red net shows the EM difference density contoured at +4.7 e.u., with the strongest regions (∼6.5 e.u.) highlighted using magenta spheres. The density fills most of the valley between spikes from the bottom of the valley at 120Å to a “height” from the viral center of ∼150Å, leaving the most distal residues of the viral surface exposed. Note that the strongest density of the heparin (which carries negatively charged sulfates) lies above a part of the valley that is strongly positively charged (blue).
