
Figure 4. Molecular interpretation of EM results (stereoscopic images).
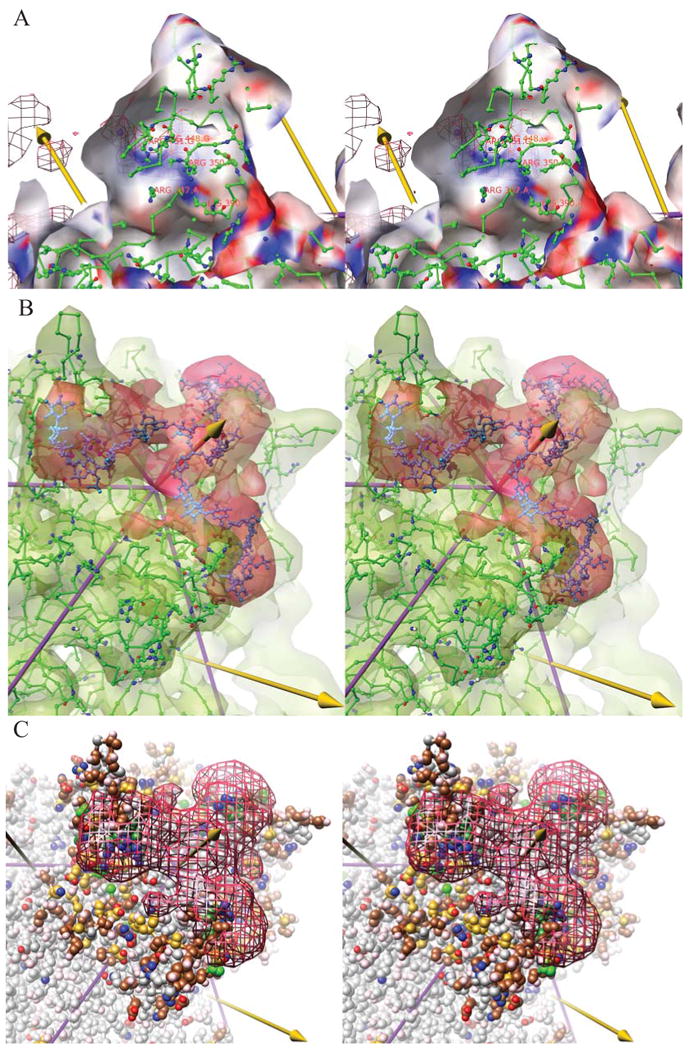
(A) The interactions of the viral protein with the heparin are best illustrated by looking outwards from inside one of the peaks surrounding a three-fold (left arrow). In this stereodiagram, the cut-away translucent surface is the experimental cryo-EM reconstruction of native, AAV-2 contoured at 3.1 e.u. and colored according to the electrostatic potential from red (most negative) to blue (most positive). The potential was calculated from the crystallographic structure (ball-&-stick). Behind the translucent surface can be seen a chicken-wire representation of the difference cryo-EM density for the heparin, contoured at a high level (5.7 e.u.) and with its strongest regions highlighted by magenta spheres. The heparin density coincides with a positively charged surface (blue strip running lower right to upper left) that is formed by the positively charged amine and guanidinium groups (blue nitrogens) of Lys390/527 and Arg350/487 from subunit A, with Arg448/585 and Arg451/588 from neighboring subunit G which together with Arg347/484 of subunit A, also in the vicinity, have been implicated in heparin-binding through structure-inspired mutagenesis (Kern et al., 2003; Opie et al., 2003; Xie et al., 2002).
(B) The difference density, contoured in red at 4.9 e.u. is commensurate in size with 3 × 9-mer saccharides, modeled in cyan ball-&-stick, surrounding a three-fold axis (central arrow). (Heparin is a heterogenous mixture – the model is not intended to represent accurately any one of the conformations averaged in the reconstruction, but only its dimensions.) The green translucent surface shows the cryo-EM reconstruction of native AAV-2 at 7.8 Ǻ resolution, contoured at 6.7 e.u. overlaid on the 3 Ǻ crystal structure(Xie et al., 2002).
(C) The heparin density, contoured at 4.7 e.u., is overlaid on the atomic structure which is colored according to atomic properties and to highlight amino acids subject to relevant mutational studies. Side chains are colored with positively changed atoms blue, negatively charged atoms red and uncharged polar atoms pink. Carbons are colored by mutation phenotype, combining the results of three studies (Kern et al., 2003; Lochrie et al., 2006; Opie et al., 2003). In green are colored residues affecting heparin interactions in any of the studies, darkly shaded for the strongest effects. Residues that did not appear to affect heparin binding are colored in brown, or in gold for those that had at least 10-fold impact upon transduction levels or infectivity. The heparin footprint has at its center the three residues with strongest impact (R448/585, R451/588 and R350/487 from), but it extends to include other charged residues for which consistent mutagenesis results have not been obtained. The footprint contains many residues (brown and gold) whose interactions were not detected previously. The gold-colored residues were previously hypothesized to affect transduction through a secondary receptor binding site proposed to be distinct from the heparin binding site, but several are within the heparin footprint.