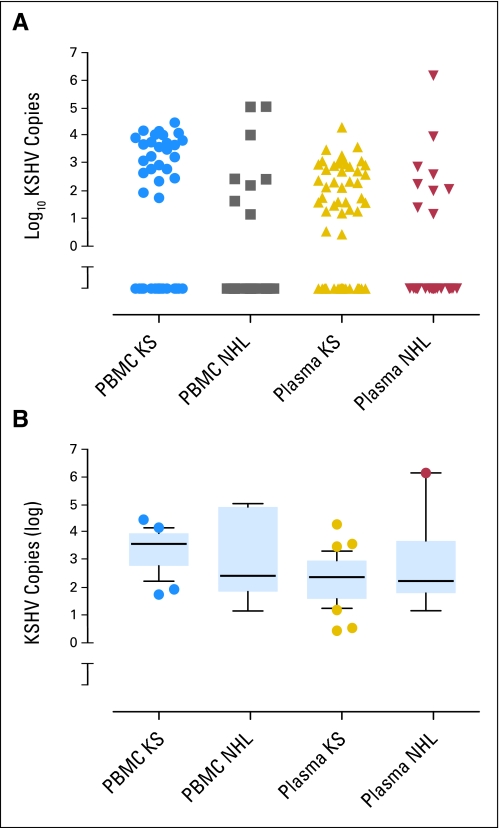
Fig 1.
Copy numbers of Kaposi's sarcoma herpesvirus (KSHV) genomes in peripheral-blood mononuclear cells (PBMCs) and in plasma of untreated patients with AIDS-KS and AIDS–non-Hodgkin's lymphoma. (A) Scatter plot that shows KSHV copy numbers in individual patients. Copy numbers are shown as the log10 of copies per million PBMCs or per 100 μL plasma. Specimens in which KSHV was not detected are plotted below the break in the Y axis. Median values are listed in Table 2. (B) Box-and-whiskers plot of the same data that excludes specimens in which KSHV was not detected. The top, middle, and bottom bars of each box represent the 75th, 50th, and 25th percentiles of copy numbers, respectively. Whiskers show the 10th to 90th percentiles. ● outliers.

