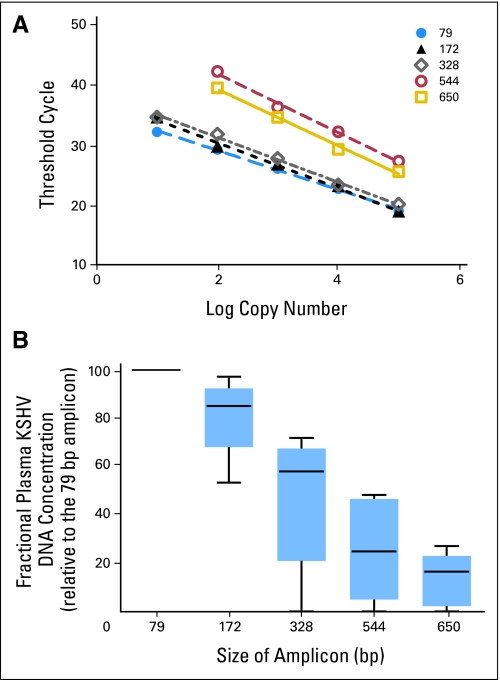
Fig 3.
Plot of fractional concentrations of plasma Kaposi's sarcoma herpesvirus (KSHV) DNA as measured with amplicons of different length (79 bp to 650 bp). Both large fragments and small fragments were present in plasma, which is consistent with the notion that KSHV is in virion particles. The median fractional KSHV DNA concentration is listed below the box plot of each amplicon size. The top, middle, and bottom bars of each box represent the 75th, 50th, and 25th percentiles of the fractional concentrations, respectively. ● outliers; X-axis, size of amplicons (in bp); Y-axis, fractional concentration of plasma KSHV DNA.

