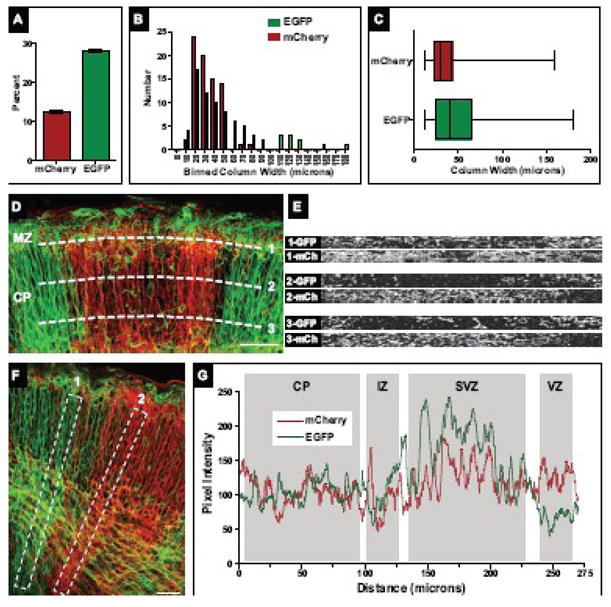
Figure 2. Cortical column size and uniformity in two-color chimeric cortices.

(A) Percentage of mCherry and EGFP-labeled cellular structures in a two-color chimeric cortex. The number of mCherry or EGFP-positive pixels was measured in individual confocal sections over multiple regions of the cortex. Shown is the average number of labeled pixels over total pixel area from all confocal images measured (n=135).
(B) Histogram of binned column width data. Both mCherry and EGFP-labeled columns showed a similar distribution in widths, though more large (>50 micron) EGFP-labeled columns were observed.
(C) Cortical column width measurements were compiled and are presented in a horizontal box and whisker format: the left and right ends of the box mark the lower and upper quartiles, respectively; the vertical line in the box is the median; and the whiskers outside the box extend to the highest and lowest value. The range in column size is similar between mCherry and EGFP-labeled populations; however, the increased number of large EGFP-labeled columns noted in (C) is reflected in the raised median and upper quartile compared to mCherry-labeled columns.
(D) Column uniformity throughout the CP. Optical slices (dashed white lines) were taken at various layers of the CP: just above the IZ (CP layer 5–6, bottom line), halfway through the CP (layer 2–4, middle line), and through the MZ (layer 1, top line). Corresponding optical slices are shown in right panels. Pronounced mixing of cell populations was largely restricted to the MZ (top right panel). (E, F) Distribution of mCherry and EGFP-labeled structures along the cortical radial axis. Linescans along predominately EGFP-positive cortical columns (left box in E, signal intensity plotted as green line in F) or mCherry-positive columns (right box in E, signal intensity plotted as red line in F) revealed increased signal variability in EGFP-dominated columns, most notably in the SVZ and VZ.
Scale bars for (D) and (F) are 50 microns.
