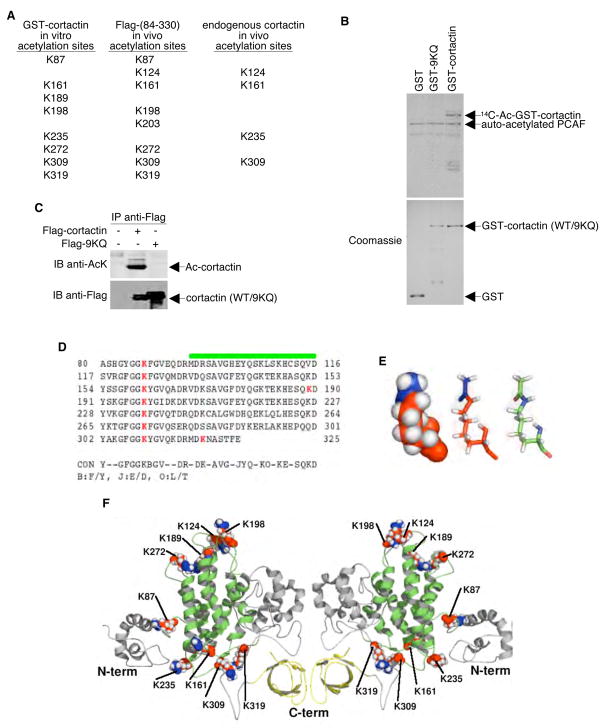
Figure 5. Identification of Acetylation Sites of Cortactin in vitro and in vivo.
(A) GST-tagged cortactin (in vitro acetylated by PCAF), Flag-tagged cortactin (expressed and purified from HeLa cells), and endogenous cortactin immunopurified with anti-cortactin antibody were cleaved with trypsin and analyzed by ion trap mass spectrometry. Positions of unambiguously identified acetylated lysine residues are listed. (B) In vitro acetylation assays performed using the catalytic domain of PCAF and GST-tagged (wildtype) or 9KQ mutant cortactin. Reaction products were resolved by SDS-PAGE. Acetylated proteins were visualized by autoradiography (top panel), and total amounts of protein were monitored by Coomassie staining (bottom panel). (C) Flag-tagged cortactin (wildtype) and Flag-tagged 9KQ mutant cortactin were expressed in HeLa cells by transient transfection. Anti-Flag immunoprecipitates were Western blotted with antibodies specific to either acetyl-lysine or Flag. (D) Alignment of the mouse cortactin repeats (residues 80 to 325). The green line represents the predicted transmembrane zone, and the red bold letters represent the potential acetylated lysine residues. (E) Representation of the acetylated residues in balls (left) and sticks (center and right). Atoms in red belong to the lysine residues and atoms in blue to the acetyl groups. The molecule on the right is colored according to atom type: carbon (green), nitrogen (blue), oxygen (red), and hydrogen (white). (F) Cartoon representations of both sides of the mouse cortactin model. The cortactin repeats are in green and the SH3 motif in the carboxyl-terminal is in yellow. The acetylated lysines are in the same color scheme described in E (left and center).

