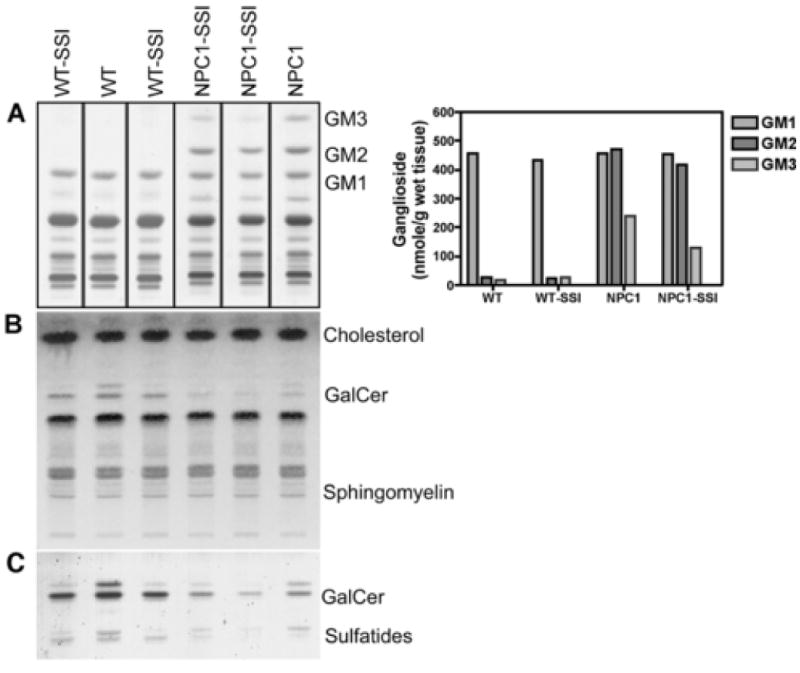
Figure 7. Lipid profiles in brain tissue from young WT and NPC1 mice treated with SSI.

The 6-day SSI treatment was administered as described in Fig. 3. The procedures for lipid extraction, purification and separation, as well as the various chromatographic systems, are described in the Material and Methods section. The brains from one WT mouse without SSI and from one NPC1 mouse without SSI were employed for glycolipid analyses. One of us (M.T.V.) had previously analyzed the glycolipid contents of brains from many WT and NPC1 mice at the same age, and found that the variations of glycolipid contents among individual mice were small. The data reported here for the untreated WT mouse and the untreated NPC1 mouse fall within the expected values. For mice with SSI treatment, the brains from two WT mice and from two NPC1 mice were employed for analyses, and the results were shown individually (in lanes 1, 3, 4, and 5). The values reported in the bar graph are the means of values from the two SSI-treated mice.
Panel A: Ganglioside patterns. The bands corresponding to gangliosides GM3, GM2 and GM1 are indicated. The adjacent bar graph reports the concentration of these three gangliosides, expressed as nmol ganglioside / g wet weight of tissue.
Panel B: Chromatographic profiles of total non-acidic lipids (chloroform:methanol 1:2 eluate from Bond-Elut C18 column). An aliquot corresponding to 1 mg tissue was applied to the plate. GalCer: galacotsylceramides.
Panel C: Galactolipids profiles (galactosylceramides and sulfatides). Galactolipids were purified as described in Material and Methods. An aliquot corresponding to 0.6 mg tissue was applied to the plate. For both lipids, the upper band corresponds to a ceramide moiety containing “normal”, unhydroxylated fatty acids, the lower band corresponds to a ceramide moiety with hydroxylated fatty acids.
