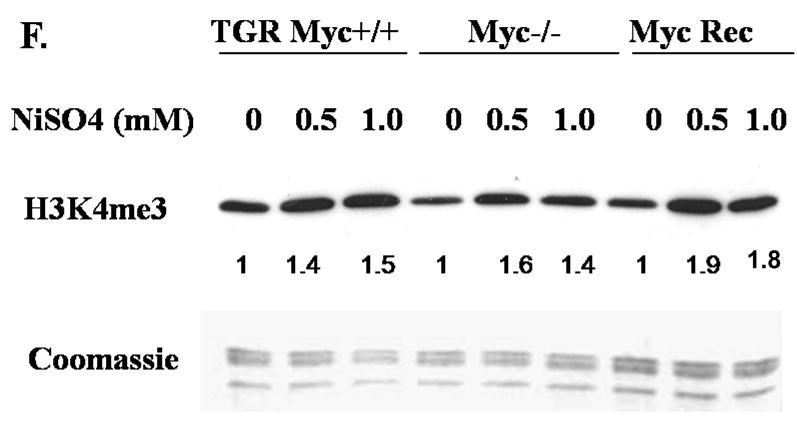
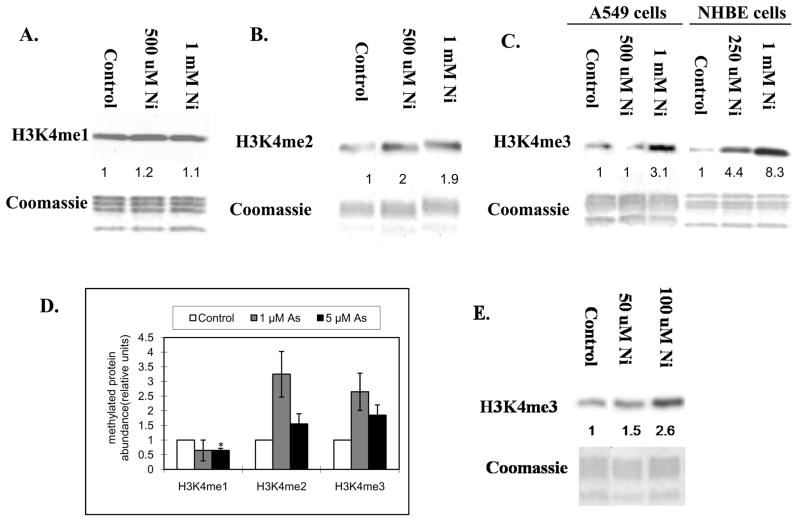
Figure 1.

A549 cells were treated with 500 μM and 1 mM of NiCl2 for 24 h (A, B and C), and 50 μM and 100 μM NiCl2 for seven days(E). NHBE cells were treated with 250 μM and 1 mM of NiSO4 for 24 h (C). TGR-1 (c-Myc+/+), HO15.19 (c-Myc−/−) and HOmyc3 (HO15.19 with reconstituted c-Myc expression) cells were treated with 500 μM and 1 mM NiSO4 for 24 h(F). Histones were extracted and immunoblotted with mono-, di- and tri- methyl H3K4 antibodies. H3K4me1, H3K4me2 and H3K4me3 represent H3K4 mono-, di- and tri-methylation respectively. Gels were stained with Coomassie blue to assess histone loading. The numbers below the figure represent the relative intensity of the bands. Shown is a representative experiment but the results were repeated at least two more times. A graph was generated from the quantification of the bands from A, B and C(D). and a students T test determined that there was a *statistically significant change (P < 0.05) compared to control samples.

