Fig. 1.
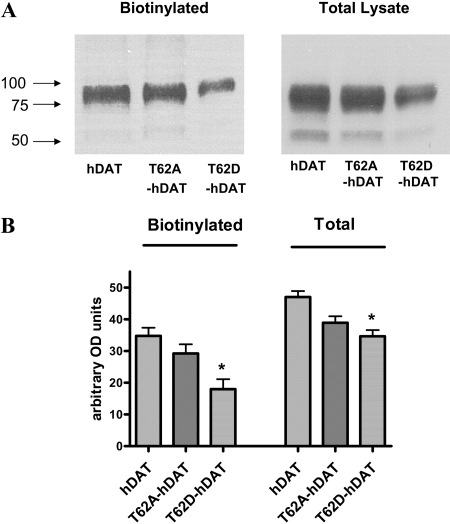
Surface expression of hDAT and mutant hDAT in HEK 293T cells. A, cell surface expression of hDAT and mutant hDAT proteins was measured by biotinylation of cell surface proteins with sulfo-NHS-SS-biotin as described under Materials and Methods. Biotinylated proteins were isolated using avidin beads and analyzed by Western blotting using a monoclonal anti-DAT antibody. The position of the 100-, 75-, and 50-kDa molecular mass markers is shown. B, quantitation of the biotinylated surface and total (in lysate) hDAT proteins in hDAT and mutant hDAT cells. The expression of the constructs was measured by Scion Image software. Mean arbitrary density units were plotted (n = 6) for the surface hDATs (biotinylated) and total hDAT (lysate) for the hDAT, T62A-, and T62D-hDAT constructs. *, one-way ANOVA, p < 0.002; in post-hoc Tukey-Kramer analysis, p < 0.01 for hDAT versus T62D-hDAT, p < 0.05 for T62A-hDAT versus T62D-hDAT. For lysate totals, one-way ANOVA, p < 0.001; in post-hoc Tukey-Kramer analysis, p < 0.001 for hDAT versus T62D-hDAT; p < 0.05 for T62A-hDAT versus T62D-hDAT.

