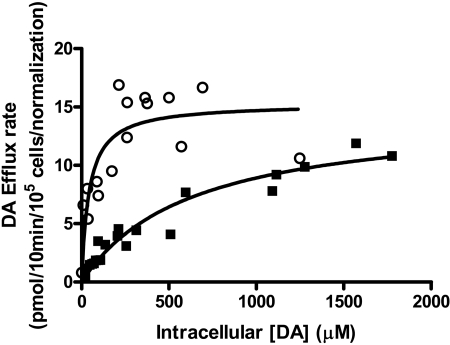
Fig. 5.
Kinetic analysis of [3H]DA efflux in hDAT and T62D-hDAT. hDAT (▪) or T62D-hDAT (○) cells (1 × 10⁵) were preloaded by incubating them in KRH containing 60 or 120 nM [3H] DA and varying concentrations of unlabeled DA (1-80 μM) for 30 min at 25°C. After loading, the efflux experiment was conducted at 25°C. Cells were washed rapidly with KRH, and fresh buffer was added. Specific efflux was determined in the presence and absence of 100 μM cocaine. The intracellular concentrations of DA were calculated in micromoles using 1.25 pl as the volume of an HEK 293 cell (Sitte et al., 2001). Initial rates of efflux were determined from 0 to 30 s (every 10 s) and plotted against the intracellular concentration of [3H]DA. Vmax and Km values for efflux were calculated using nonlinear regression analysis in Prism 4. Statistical significance was determined with an F test using Prism version 4. The null hypothesis was that the best-fit parameter for the value did not differ among the two cell types. A conclusion of statistical significance represents a rejection of the null hypothesis and indicates a difference among designated values. Km values for the two mutants differed at p < 0.0001.

