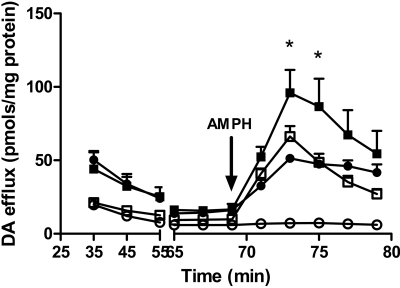
Fig. 8.
AMPH stimulated DA efflux in hDAT- and T62D-hDAT cells in the presence and absence of Zn2+. T62D-hDAT cells were loaded with 5 μM DA as described under Materials and Methods in the presence of 30 μMZn2+, and hDAT cells were loaded in the absence of Zn2+ at 37 °C for 30 min. AMPH-stimulated DA efflux was measured by superfusion as described under Materials and Methods in either the presence (▪, hDAT; ▪, T62D-hDAT) or absence of Zn2+ (□, hDAT; ○, T62D-hDAT) of 30 μM Zn2+ as indicated (n = 3). Baseline values of [3H]DA were collected for 70 min until the addition of 10 μM AMPH (arrow). Initial levels of DA in the cells were the following: T62D-hDAT without Zn2+, 3.8 ± 0.9 nmol/mg protein; T62D-hDAT with Zn2+, 12.2 ± 1.6 nmol/mg protein; hDAT without Zn2+, 10.5 ± 0.3 nmol/mg protein; hDAT with Zn2+, 11.8 ± 0.6 nmol/mg protein. In two-way ANOVA analysis, p < 0.0001 for time (fraction) and the mutant/Zn2+ condition; p < 0.0001 for the interaction; *, p < 0.01 for hDAT with Zn2+ versus all other groups. T62D-hDAT with no Zn2+ differed from all other groups at p < 0.001. There was no statistical difference between hDAT with no Zn2+ and T62D-hDAT with Zn2+.

