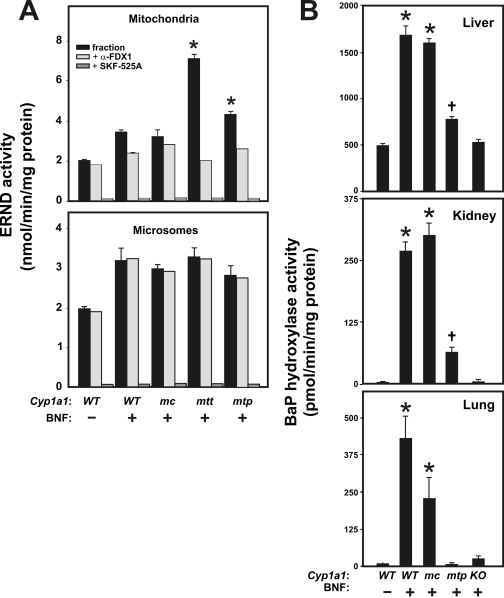
Fig. 4.
Mitochondrial versus microsomal enzyme activities in BNF-treated and untreated mice. A, ERND is expressed as the rate of HCHO formation in nanomoles per minute per milligram of protein. Inhibition of ERND activity by prior addition of α-FDX1 or SKF-525A was carried out as described previously (Anandatheerthavarada et al., 1997, 1999). *, P < 0.05, when hepatic mitochondrial ERND activity from BNFtreated mtt1A1 or mtp1A1 mice is compared with that from BNFtreated WT 1A1 mice. B, BaP hydroxylase activity is expressed in picomoles of 3plus 9-hydroxyBaP per minute per milligram of protein. Note the different values on the y-axis in each panel. Data are reported as means ± S.E.M. (n = 3 or 4 mice per group). Designation of mouse lines is same as that in Fig. 2. *, P < 0.01, when microsomal BaP hydroxylase from BNF-treated WT 1A1 or mc1A1 is compared with that from untreated WT 1A1 mice. †, P < 0.05, when microsomal BaP hydroxylase from BNFtreated mtp1A1 is compared with that from untreated WT 1A1 mice.

