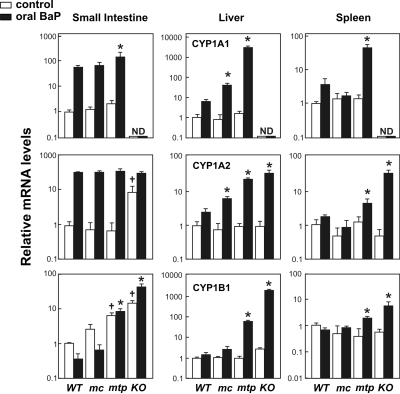
Fig. 6.
CYP1 mRNA levels after 18 days of continuous oral BaP (125 mg/kg/day). The CYP1A1 mRNA levels from cornoil treated WT 1A1 mice in each tissue were set as “1.0 control,” and relative mRNA levels are expressed as -fold increases on a logarithmic scale; note values on the y-axis vary over a >1000-fold range. ND, nondetectable. The mRNA levels are expressed relative to β-actin mRNA levels; thus, values within a tissue, but not between tissues, can be compared. Data are reported as means ± S.E.M. of four mice per group. Designation of mouse lines is the same as that in Fig. 2. *, P < 0.05, compared with mRNA levels for that gene in BaP-treated WT 1A1 mice. †, P < 0.05, compared with mRNA levels for that gene in corn oiltreated WT 1A1 mice.

