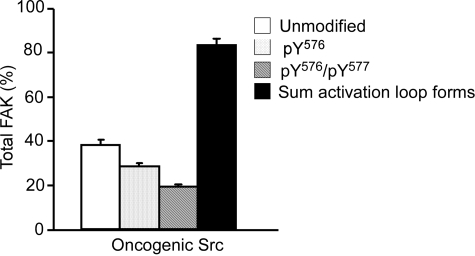
Fig. 3.
Quantification of FAK activation loop Tyr576 and
Tyr577 in MEFs expressing oncogenic Y529FSrc. Shown are
amounts of unmodified Tyr576/Tyr577 (□),
mono-pTyr576 ( ),
and bis-phosphorylated pTyr576/pTyr577
(
 ) activation loop peptides,
and the sum amount of activation loop peptides (▪) from a FAK trypsin
digest after immunoprecipitation from confluent monolayers of MEFs expressing
oncogenic Y529FSrc. The mounts of each peptide are shown after
correction for FAK immunoprecipitation recoveries and normalization to the
amount total FAK. Data points represent the means of three separate
experiments, where error bars are ± S.E.M.

