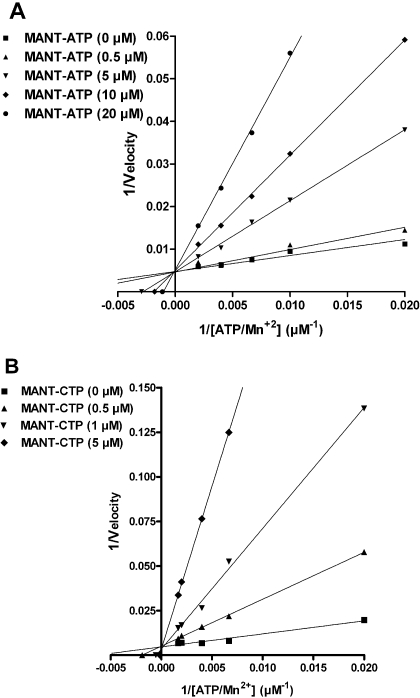
Fig. 1.
Lineweaver-Burk analysis of the inhibition of EF3 AC activity by MANT-ATP and MANT-CTP. AC activities were determined as described under Materials and Methods with the indicated concentrations of MANT-ATP (0, 0.5, 5, 10, and 20 μM) (A) and MANT-CTP (0, 0.5, 1, and 5 μM) (B). Reaction mixtures contained 10 pM EF3, 100 mM KCl, 100 μM free Ca2+, 5 mM free Mn2+, 100 μM EGTA, 100 μM cAMP, 100 nM calmodulin, 0.2 μCi/tube [α-32P]ATP, and unlabeled ATP/Mn2+ concentrations indicated in the graph. Data were plotted reciprocally and analyzed by linear regression according to Lineweaver-Burk. Shown are the results of a representative experiment performed in triplicates. Similar results were obtained in two independent experiments.

