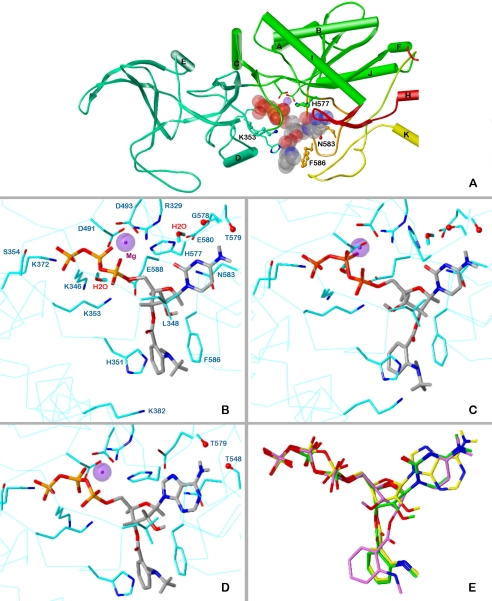
Fig. 4.
Docking of MANT-CTP and MANT-ATP on EF-CaM. The minimized models are based on the crystal structure of EF-CaM-3′ANT-2′deoxy-ATP, PDB 1lvt (Shen et al., 2002). Colors of atoms, unless otherwise indicated: P, orange; O, red; N, blue; C, H, gray; Mg2+, purple spheres. A, topology diagram of the EF domains surrounding the binding site with docked 3′-MANT-CTP (represented as transparent Corey/Pauling/Koltun model). Domains CA, green; CB, green-blue; switch A, red; switch B, orange; switch C, yellow. Amino acids subjected to mutation, ball-and-stick models. B to D, detailed representation of interactions of MANT-nucleotides with EF-CaM. The side chains of amino acids within a sphere of 3 Å around the ligand and Mg2+ are drawn as sticks (C atoms, cyan) and labeled. For clarity, repeating labels are omitted in C and D (see B). Cα-trace, cyan line. B, docking of 3′-MANT-CTP. C, docking of 2′-MANT-CTP. D, docking of 3′-MANT-ATP. E, superposition of the docked MANT nucleotides based on alignment of the three EF models (all heavy protein atoms considered). Colors of C and essential H atoms: 3′-MANT-CTP, green; 2′-MANT-CTP, purple; 3′-MANT-ATP, yellow.

