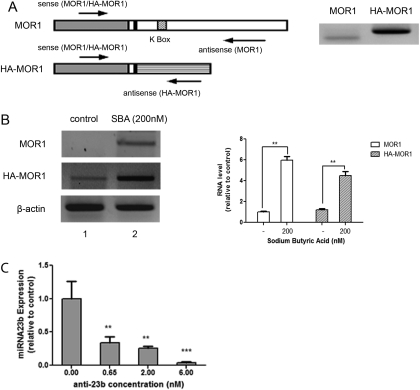
Fig. 2.
MOR1 and HA-MOR1 RNAs in N2A-MOR cells. A, structure of MOR1 and HA-MOR1 RNAs and the positions of RT-PCR primers. Left, MOR1 cDNA (gray box), MOR1 3′-UTR (large blank box), sequence in pRc/CMV plasmid downstream from the MOR1 cDNA (large striped box), K box (small striped box), and 30-base pair MOR1 3′-UTR that is included in both mRNAs (small blank box). The arrows represent the approximate positions for the sense and antisense RT-PCR primers. Right, N2A-MOR cells were treated with 200 nM SBA for 24 h, 1 μg of RNA was amplified by RT-PCR using MOR1 (left lane) or HA-MOR1 (right lane) primers. B, N2A-MOR cells were treated with 200 nM SBA for 24 h. RNA was extracted and 1 μg of RNA (or 500 ng for β-actin) was analyzed by one-step RT-PCR. Lane 1, control (mock treatment); lane 2, treated with 200 nM SBA. The graph shows the intensity of MOR1 or HA-MOR1 signals normalized to that of β-actin; data are expressed relative to the intensity of the control sample (lane 1). The experiments were repeated three times; the Student's t test was performed by comparing each sample to the control sample. n = 3; **, p < 0.01. C, Anti-23b primer (0, 0.65, 2, or 6 nM) was transfected into N2A-MOR cells and miRNA-enriched RNA was extracted 24 h later. Twenty nanograms of RNA were used for reverse transcription using miRNA23b and snoRNA234 primers, followed by real-time qPCR. The graph shows the miRNA23b levels, normalized to snoRNA234 from a single experiment performed in duplicate. The experiment was repeated three times with similar results. Student's t test was performed by comparing each sample to the control sample (0.00 nM anti-23b). n = 3; **, p < 0.01; ***, p < 0.001.

