
Figure 2.
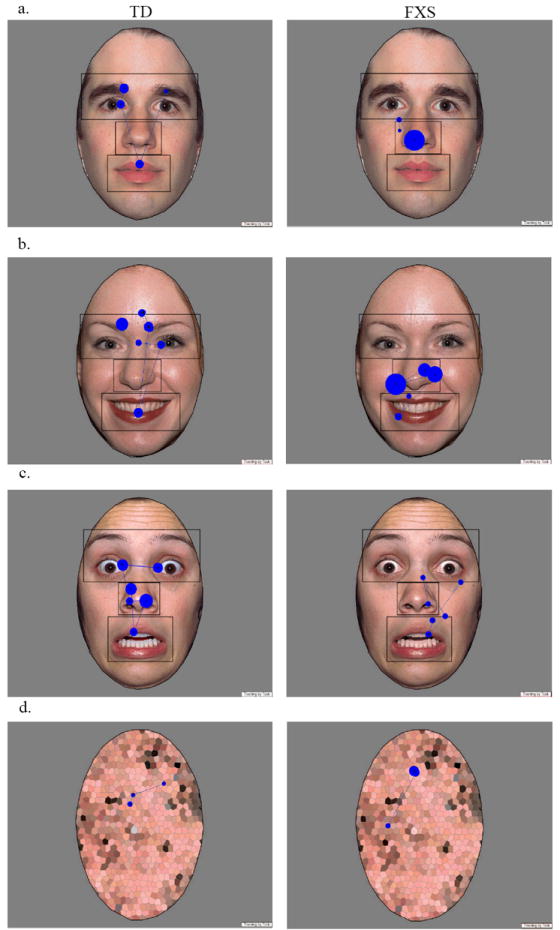
Example fixation plots from one subject in each group (TD on left, FXS on right) for a single (a) calm, (b) happy, (c) fearful, and (d) scrambled face trial. The plot displays a static frame of fixation data for each image. Each fixation is illustrated with a blue circle where the radius represents the length of the fixation.