
Figure 3.
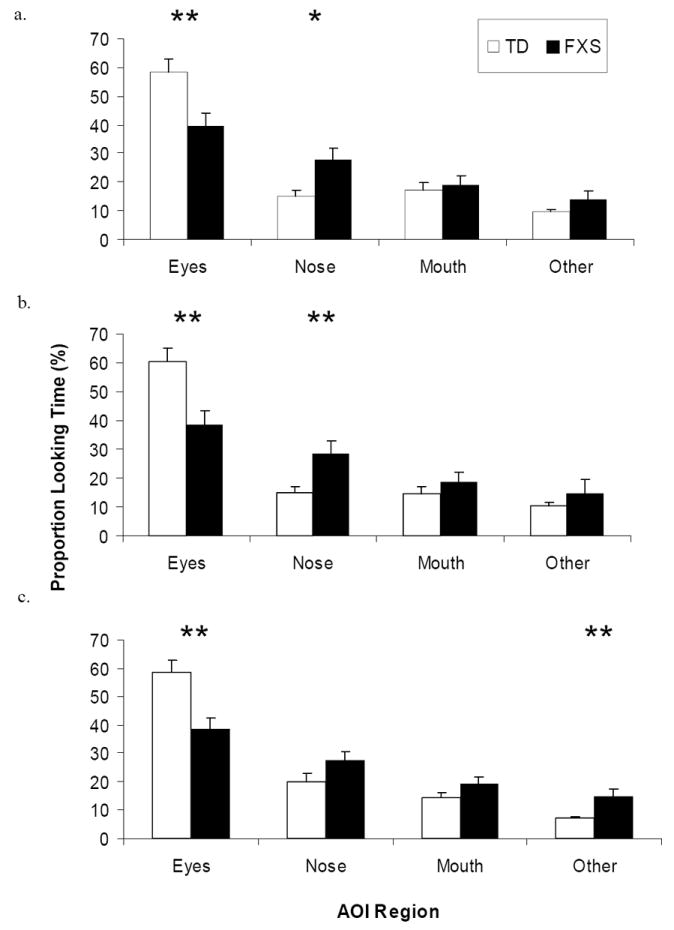
Mean proportion gaze duration to each AOI region by group for (a) calm, (b) happy, and (c) fearful faces. Gaze durations are reported as percentages and error bars represent SEM. Asterisk (*) and double asterisk (**) indicate significant difference between pairwise comparisons at the p < .05 and p < .01 level, respectively.