Figure 3.
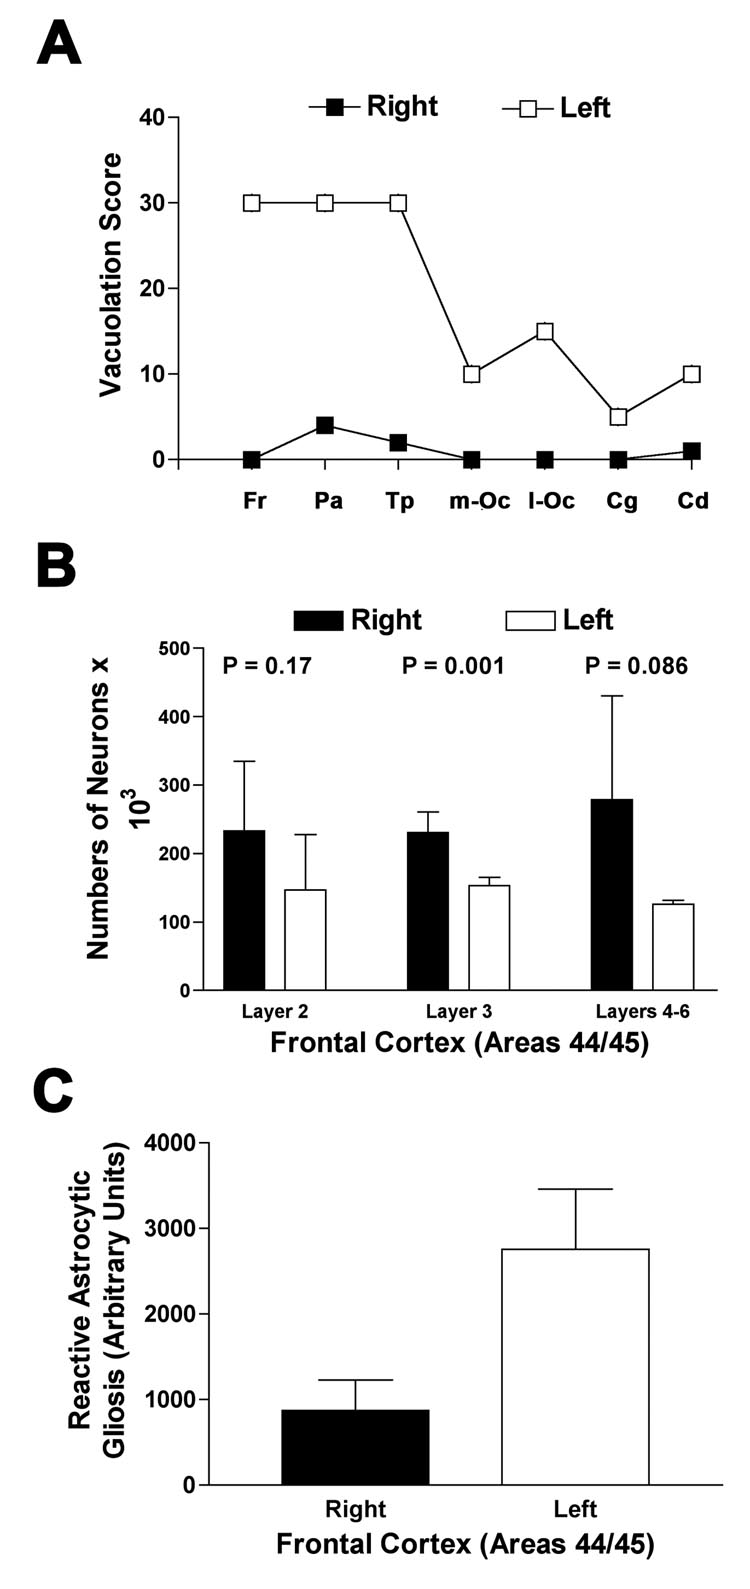
Figure 3a. Semi-quantitative estimate of brain area occupied by vacuoles as determined by a single rater (S.J.D.)17 Fr = Frontal lobe; Pa = parietal lobe; Tp=temporal lobe; m-Oc= medial occipital lobe; l-Oc=lateral occipital lobe; Cg=anterior cingulate; Cd=caudate head
Figure 3b. Mean neuron counts in three different cortical layers regions using stereology, a modified automated random sampling method, from multiple 50 µM sections of cortex.18. Bars show standard deviation.
Figure 3c. Mean comparison of gliosis in right versus left frontal cortex (Brodmann’s area 44/45) using automated integrated optical density (Bioquant Image Analysis Corp, Nashville, TN) measurement of GFAP immunostaining (Dako, Inc, Carpinteria, CA). Bars show standard deviation of counts.

