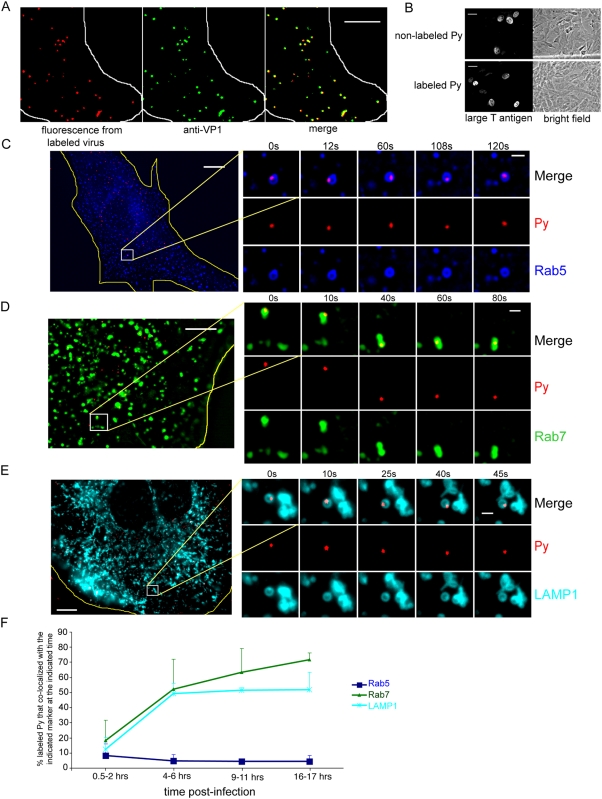
Figure 1. Time-dependent transport of Py through the endolysosome.
(A) NIH 3T3 cells were incubated with Texas-Red-labeled purified Py for 3 hrs at 37°C, washed, and subjected to immunofluorescence using a VP1 antibody followed by FITC-labeled secondary antibody. White line, edge of cell. Scale bar, 5 µm. (B) Cells were incubated with labeled or non-labeled Py for 48 hrs, and the extent of infection assessed by immunofluorescence using a Py large T antigen antibody. Cells stained with large T antigen in the nucleus were scored as positive for infection. Scale bars, 30 µm. (C–E) Live cell imaging of labeled Py in cells expressing (C) CFP-Rab5, (D) YFP-Rab7, or (E) LAMP1-YFP. C, D, and E are images taken at the 4–6 hrs post-infection time point. Yellow lines, edge of cells. Scale bars, 10 µm (whole cell) and 1 µm (inset). (F) Quantification of the extent of co-localization between labeled Py and the respective markers at the indicated post-infection time points. For each time point, at least 90 viral particles were analyzed from 3 cells. Data are the mean+/−SD.

