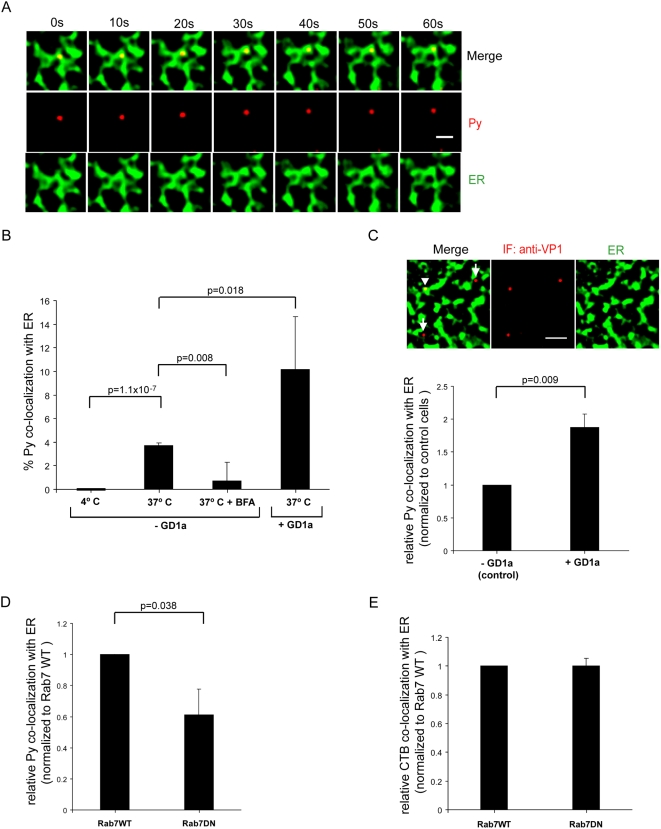
Figure 5. Increased co-localization of Py with the ER in GD1a-supplemented cells.
(A) Live cell imaging of labeled Py co-localization with the ER. NIH 3T3 cells co-expressing CFP-HO2 and YFP-Rab7 were infected with labeled Py and the extent of co-localization of Py with the ER was analyzed 4–6 hrs post-infection. The images of the ER were subjected to filtering (see Figure S5) to more clearly define the ER tubule boundaries. Scale bar, 1 µm. (B) Quantification of Py and ER co-localization in GD1a (4°C, 37°C, BFA+37°C) and GD1a-supplemented cells. More than 300 viral particles were analyzed from at least 5 different cells. (C) Py and ER co-localization in control and GD1a-supplemented cells using immunofluorescence staining. Scale bar, 2 µm. (below) Quantification of the extent of co-localization, normalized to control cells. Arrowhead, Py that co-localized with the ER. Arrow, Py that did not co-localize with the ER. (D) Quantification of Py and ER co-localization in cells expressing either wild-type YFP-Rab7 (WT) or dominant-negative YFP-Rab7 (DN) using live cell tracking, as in A. The extent of co-localization was normalized to wild-type Rab7 expressing cells. (E) Quantification of CTB and ER co-localization in cells expressing either wild-type YFP-Rab7 or dominant-negative YFP-Rab7. Data are the mean+/−SD. A two-tailed t test was used.

