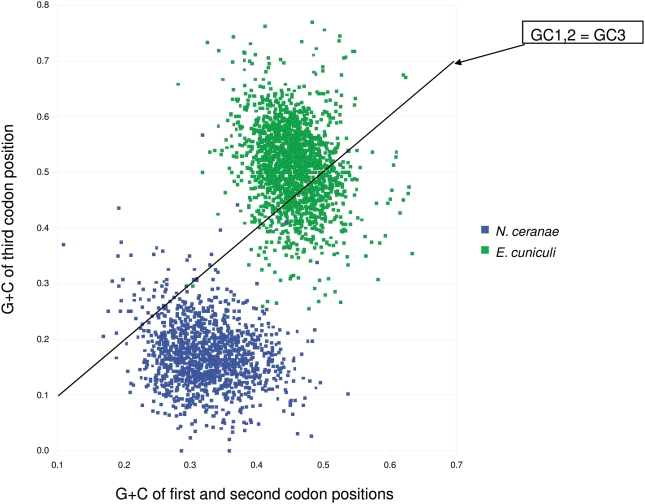
Figure 4. G+C content of N. ceranae and E. cuniculi genes.
The horizontal axis is the proportion of G+C in the first two codon positions (GC1,2), whereas the vertical axis represents the G+C content of the third position (GC3). Substitutions at the third position are usually synonymous and thus are expected to reflect mutational equilibrium in the absence of other evolutionary forces such as codon bias. The two genomes overlap very little in G+C content of genes, and differ more at the third position than at the first two positions.

