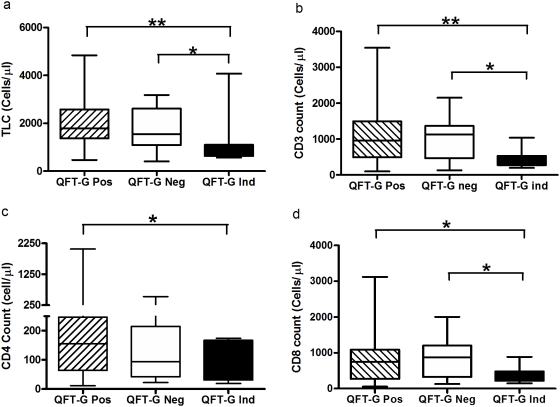
Figure 2. The level of total lymphocyte and T cell counts in QFT-G positive, negative and indeterminate subjects.
The decline of total lymphocytes (a) or CD3 count (b) or CD4 count (c) or CD8 count (d) was associated with QFT-G indeterminate only but not with QFT-G negative. Box and Whisker plots show range, inter-quartile range and median. QFT-G – Quantiferon TB Gold (in-tube), * significant difference p<0.05, **significant difference p<0.01 by Mann-Whitney U test.

