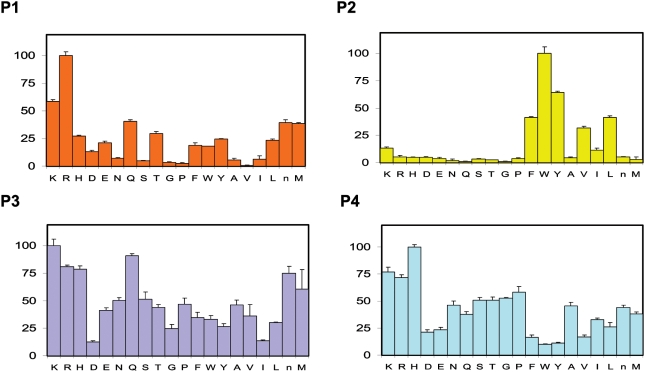
Figure 6. P1–P4 specificity profile of SmCL3 using positional scanning-synthetic combinatorial libraries.
The P2 substrate position shows the strongest preference for specific amino acid types with large hydrophobic residues being most favored. Y-axis represents % of preference for the particular amino acid when 100% represents most preferred residue.

