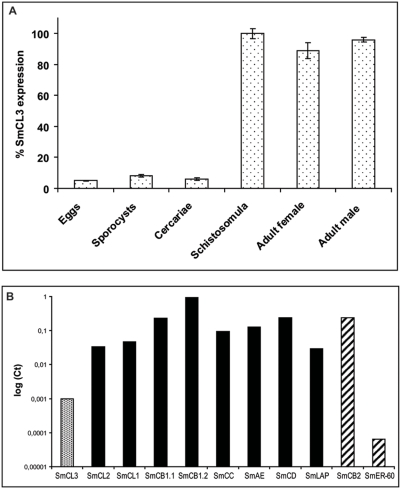
Figure 8. Developmental regulation of SmCL3 transcription and transcript abundance relative to other S. mansoni proteases.
(A) The highest CT value (which was 0.94) was set as 100%. (B) In the adult worms (mixed sexes) CT levels of mRNA encoding SmCL3 (dotted bar) were compared with gut-associated proteases (black bars) and two other proteases, the tegumental/parenchymal SmCB2 and endoplasmatic reticulum-associated SmER-60 (striped bars). Standard deviations were never greater than 0.3 for initial CT values. For enzyme nomenclature [7],[46] see Introduction.

