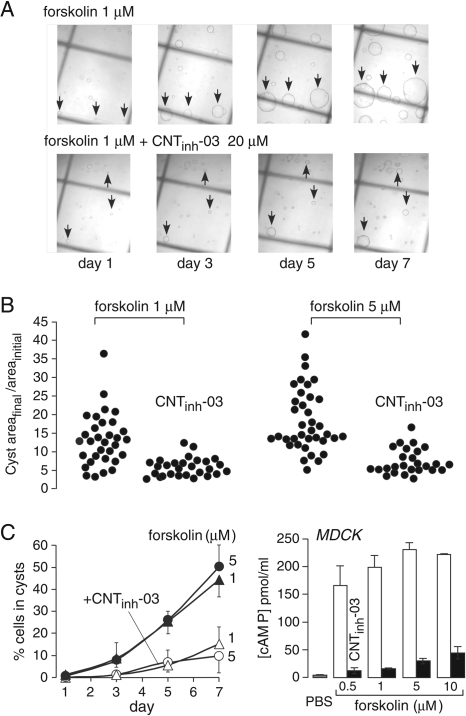
Fig. 5.
Inhibition of MDCK cell cyst formation and expansion as a model of polycystic kidney disease. A, MDCK cells were cultured in a collagen matrix and exposed for 7 days to 1 μM forskolin (top) or 1 μM forskolin together with 20 μM CNTinh-03 (bottom). Arrows point to developing cysts. B, cysts growth rates. Growth rates determined for individual cysts from cyst area at day 7 divided by initial cyst area at day 1 (Cyst areafinal/areainitial). Each closed circle represents one cyst. C, left, percentage of MDCK cells that developed into cysts. MDCK cells were treated for 7 days with forskolin (1 or 5 μM), without or with 20 μM CNTinh-03. Data shown as mean ± S.E. (n = 4 sets of cultures). Right, cAMP concentration in MDCK cells incubated with indicated concentrations of forskolin, without or with 20 μM CNTinh-03 (SE, n = 4).

