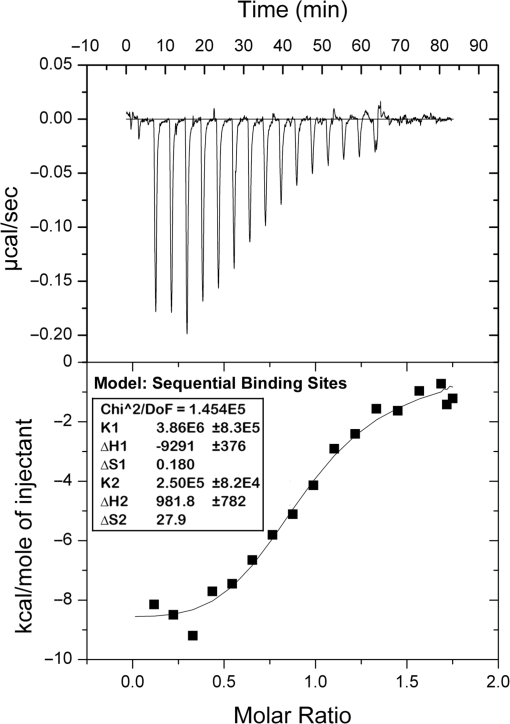
Figure 4.
Analysis of the β+–δ interaction using isothermal titration calorimetery (ITC). ITC analysis was performed as described in ‘Materials and Methods’ section. The top panel shows heat changes associated with each injection of β+ clamp. The bottom panel shows the fit of the integrated heats to the sequential binding sites model. KD values were calculated by taking the reciprocal of K1 (3.86 × 10⁶) and K2 (2.50 × 10⁵) derived from the fit to the sequential binding sites model (inset).

