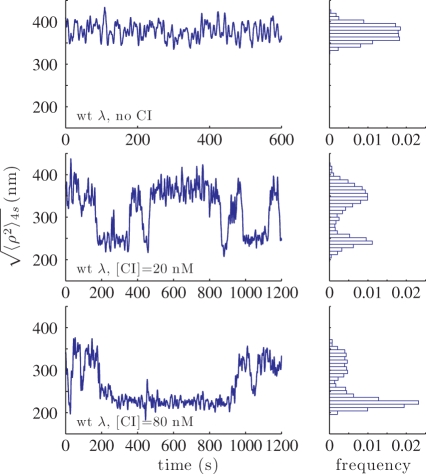
Figure 3.
 as a function of time for beads tethered by a 3477-bp DNA fragment containing the oL-oR regulatory regions separated by 2317 bp (wt λ DNA): (upper) In the absence of CI (control), (middle) In the presence of 20 nM, and (lower) 80 nM CI. Frequency histograms, corresponding to the individual TPM traces, are shown to the left. The histograms are normalized to the total number of events and to the bin width (8 nm).

