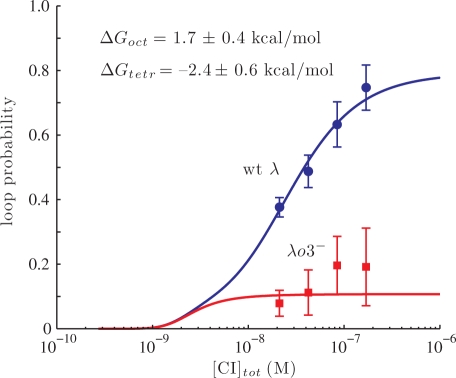
Figure 5.
Loop probability as a function of CI concentration for wt λ (dots) and λo3− DNA (squares). The lines are the result of the global simulation performed as explained in the text. Errors on the fitted parameters have been estimated at 95.4% confidence interval using constant χ2 boundaries as a confidence limit [(45) and Supplementary Data, Figure S5]. χ2 = Σ [(expected – data)/error)2] = 3.02, where expected = expected values of the data; data = experimentally observed value of the data; error = error on the data.

