Fig. 1.
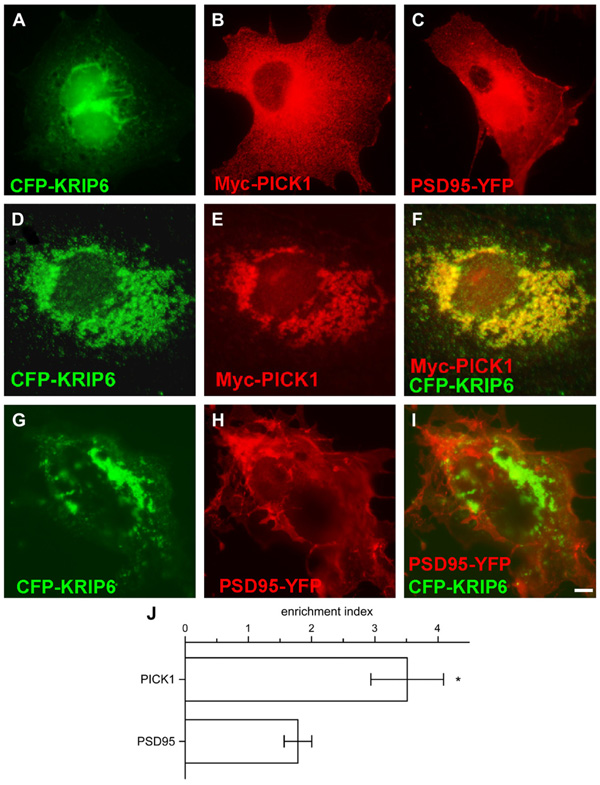
KRIP6 specifically co-clusters with PICK1, but not with PSD95. (A–F) Fluorescence images of COS-7 cells expressing CFP-KRIP6, Myc-PICK1 and PSD95-YFP alone (A–C) or co-expressing CFP-KRIP6 and Myc-PICK1 (D–F) stained with monoclonal mouse anti-Myc antibodies and visualized with Texas Red or Alexa 568 conjugated secondary antibodies (B, E, F). Fluorescence images of COS-7 cells co-expressing CFP-KRIP6 and PSD95-YFP (H, I). CFP images and YFP images in A, D, G and C, H are shown, respectively, in the green and red channels and Myc-PICK1 is shown in the red channel (B, E). Comparing merged images of CFP-KRIP6 and Myc-PICK1 (F) with CFP-KRIP6 and PSD95-YFP (I), it is evident that PICK1, but not PSD95, co-clusters with KRIP6. (J) Bar graph plots the enrichment index (fluorescence density ratio in KRIP6 clusters versus the entire cell) of PICK1 and PSD95 in the presence of KRIP6. PICK1 has an enrichment index of 3.51 ± 0.58 (n = 9) and was significantly (p < 0.02, Mann–Whitney t-test) more enriched in KRIP6 clusters compared to PSD95 (1.78 ± 0.22, n = 6). Data are expressed as mean ± SEM. Scale bar = 5 µm.

