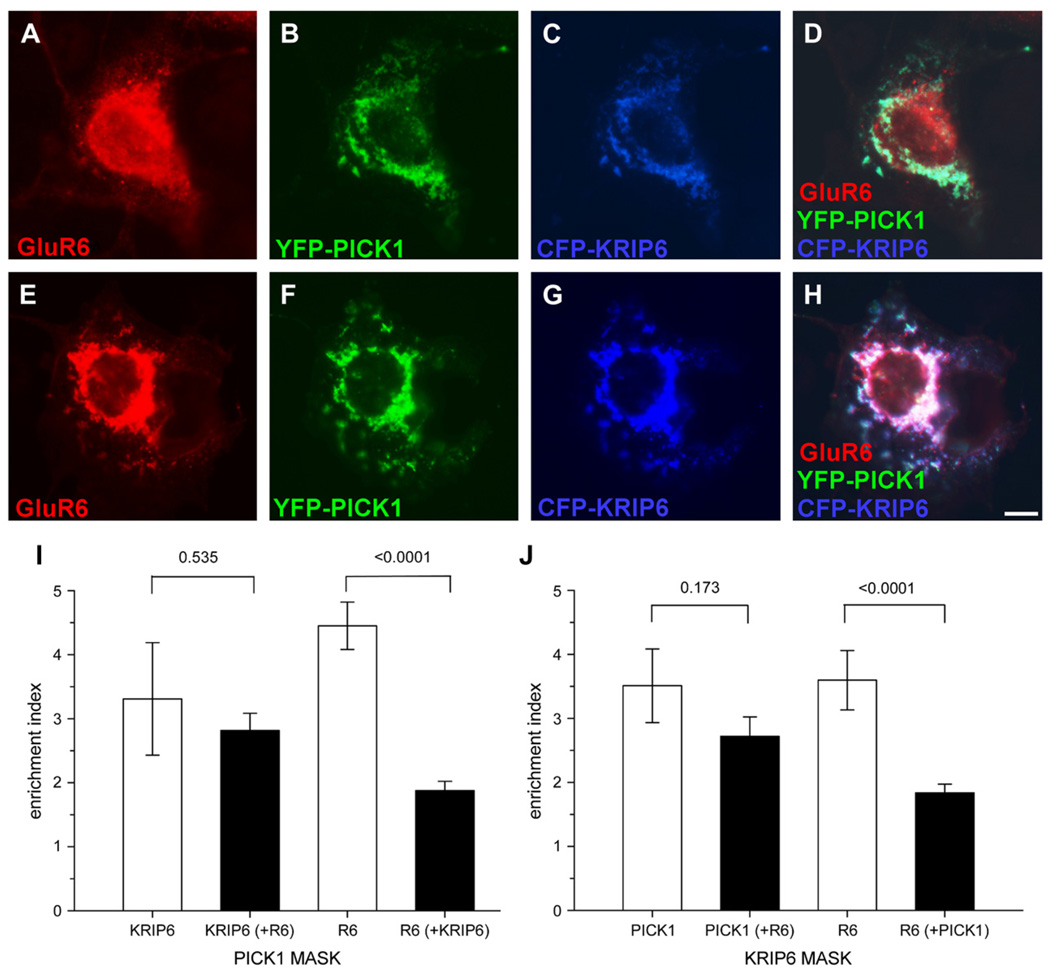
Fig. 3.
The presence of GluR6 does not affect the interaction between KRIP6 and PICK1. (A–H) Fluorescence images of representative examples of COS-7 cells expressing CFP-KRIP6, YFP-PICK1 and GluR6, stained with polyclonal anti-GluR6/7 antibodies and visualized with Alexa 647 conjugated secondary antibodies. GluR6 images are shown in red (A, E, D, H). YFP (B, F, D, H) and CFP (C, G, D, H) images are shown in green and blue, respectively. From the merged images (D, H) is evident that GluR6 is either distributed independently from PICK1 and KRIP6 (D) or joins PICK1 and KRIP6 clusters (H). (I) Bar graphs plot the enrichment index of KRIP6 co-expressed with PICK1 in the absence (first from left) or in the presence of GluR6 (second from left). The enrichment index of KRIP6 is calculated through a PICK1 MASK and expressed as fluorescence density ratio of KRIP6 in PICK1 clusters versus the whole cell. The enrichment index of KRIP6 was unchanged by co-expression of GluR6 (3.31 ± 0.88, n = 9 versus 2.82 ± 0.27, n = 28, p = 0.535, Mann–Whitney rank sum test). A representative example of KRIP6 and PICK1 co-expression in the absence of GluR6 is shown in Fig. 1A–C. Quantification of GluR6 enrichment in PICK1 clusters, either in the absence (third bar from left) or in the presence of KRIP6 (fourth bar from left) shows that GluR6 association with PICK1 is dramatically reduced in the presence of KRIP6. The enrichment index of GluR6 and PICK1 alone (4.45 ± 0.37, n = 17) was reduced to 1.88 ± 0.14 (n = 28) by co-expression of KRIP6 (p < 0.0001, Mann–Whitney rank sum test). A representative example of GluR6 and PICK1 is shown in Fig. 2D–F. (J) The same data set of panel I is analyzed using a KRIP6 MASK. Consistent with the results shown in panel I, PICK1 co-clustered with KRIP6 equally well in the absence (enrichment index = 3.51 ± 0.58, n = 9) or in the presence (enrichment index = 2.72 ± 0.30, n = 28) of GluR6. In contrast, GluR6 co-clustering with KRIP6 (enrichment index = 3.60 ± 0.46, n = 12) was significantly reduced (p < 0.0001, Mann–Whitney rank sum test) by co-expression of PICK1 (enrichment index = 1.84 ± 0.14, n = 28). A representative example of GluR6 and KRIP6 is shown in Fig. 2A–C. Data are expressed as mean ± SEM. Scale bar = 10 µm.

