Figure 3.
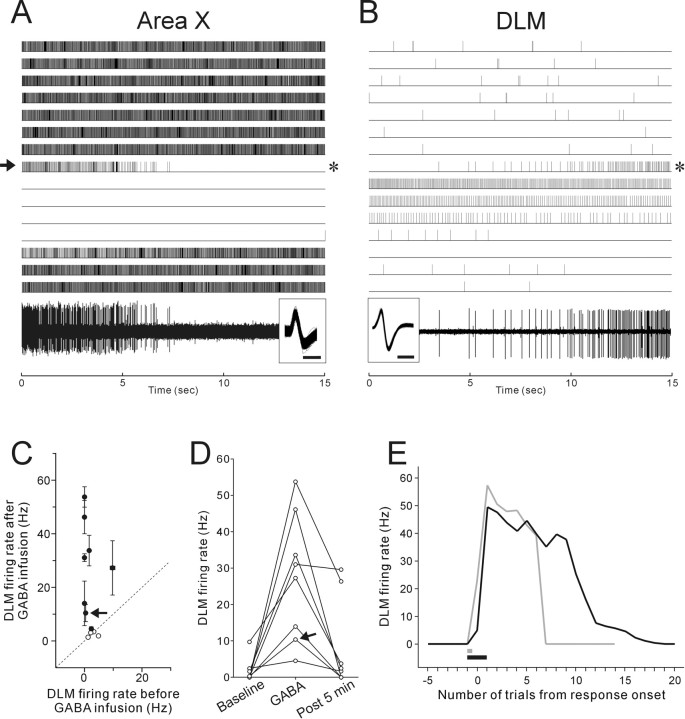
Effects of Area X inactivation on Area X and DLM activity. A, B, The raster (top) shows the single-unit activity of Area X (A) and DLM (B) neurons, recorded simultaneously with two different electrodes, responding to GABA infused into Area X for 20 s (the arrow on the left side of the Area X raster). Note that DLM activity increases as Area X is inactivated by GABA infusion. The timing of GABA responses is not exactly matched because Area X and DLM are topographically connected, with only 1–2 Area X neuron terminals per DLM neuron (Johnson et al., 1995; Luo et al., 2001), so that in simultaneous recordings of Area X and DLM the sites in each nucleus are related but not perfectly topographically matched. Raw traces of the Area X and DLM activity in the trials indicated by the asterisks on the right side of each raster are shown at the bottom with the overlaid spike waveforms in the inset; calibration: 0.5 ms. C, Mean firing rates before GABA infusion were plotted against mean firing rates after GABA infusion for all DLM neurons tested. The GABA-response trials after GABA infusion were defined in individual neurons depending on GABA infusion time (see Materials and Methods). The diagonal line marks where cells would lay if mean firing rates before and after GABA infusion were equal. The filled circles indicate that the differences are statistically significant (Mann–Whitney U test, p < 0.05). The arrows in C and D indicate the neuron shown in B. The majority of neurons showed a significant increase in firing rates after GABA infusion. D, Recovery of LMAN firing rates after the GABA responses. For all DLM neurons that exhibited significantly increased activity after GABA infusion, firing rates before GABA infusion (baseline), in the GABA-response trials (GABA), and 5 min (i.e., 10 trials) after the end of GABA infusion (post 5 min), are shown. E, Time courses of firing rate changes in a single DLM neuron after different GABA infusion times. Gray and black lines indicate firing rate changes after GABA infusions for 30 and 90 s, respectively. The infusion periods are indicated as bars with corresponding colors. Note that DLM firing rates stayed high for longer if the duration of GABA infusion into Area X was increased.

