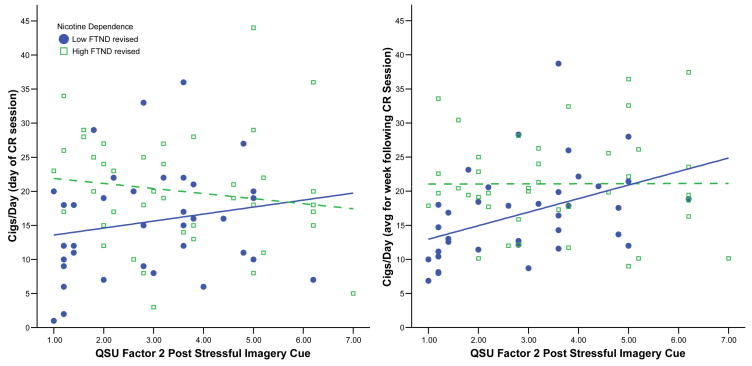
Figure 1.
Craving and nicotine dependence as predictors of smoking behavior, both on day of cue reactivity testing (left panel) and week following cue reactivity testing (right panel). Fitted regression lines indicate low dependence (solid line) and high dependence (dashed line). CR: Cue Reactivity; FTND: Fagerström Test for Nicotine Dependence (revised to omit cigs/day item)

