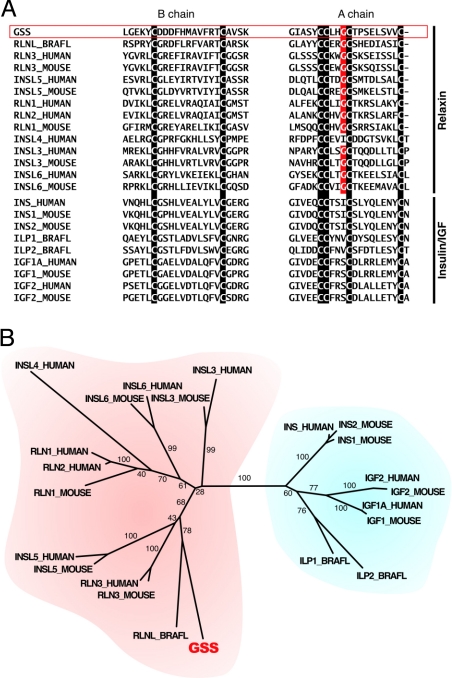
Fig. 3.
Alignment of the peptide sequences and the phylogenetic tree of the GSS and insulin/IGF/relaxin superfamily. The descriptions of the abbreviations and the sequence sources are given in Fig. S2. (A) Two parts of the whole peptide sequence alignment (Fig. S2) around the B and A chain regions. The cysteine residues that distinguish the insulin/IGF/relaxin superfamily peptides are indicated by the white characters on the black background. The glycine residues that are very common in the A peptides of the relaxin subfamily, but not in that of the insulin/IGF subfamily, are indicated by the white characters on the red background. (B) The phylogenetic tree constructed from the alignment by using the neighbor-joining method as described in this work (Fig. S3). The number located beside each branch is the bootstrap score. The relaxin and the insulin/IGF subfamilies are indicated by red and blue backgrounds, respectively.

