
Figure 5.
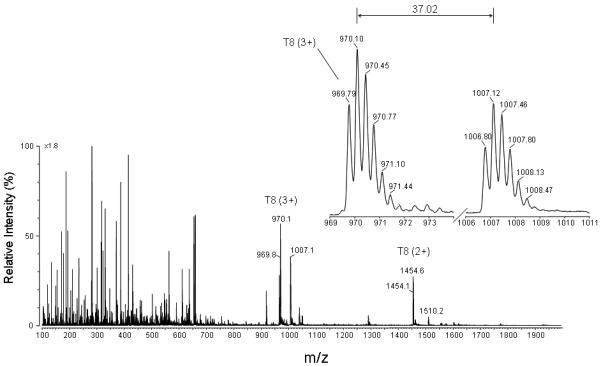
Full scan mass spectrum of the fraction that showed anti-DMPO binding. The fraction corresponding to peak 1 in Fig. 4 and eluting at approximately 75.4 min was lyophilized, resuspended in 50:50 acetonitrile/H2O + 0.1 % formic acid, and directly infused into the electrospray source of a Micromass Q-TOF hybrid tandem mass spectrometer. An expanded view of a pair of ions having the same charge state (+ 3 ions) and a mass-to-charge (m/z) difference of 37.0 is shown. This mass difference corresponds to the loss of one molecule of DMPO.