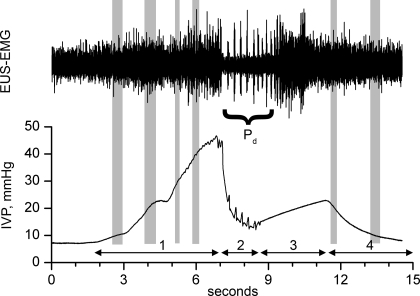
Fig. 1.
Analysis of EUS-EMG waveforms. EUS-EMG and intravesical pressure (IVP) are shown for the 4 phases of a phasic voiding contraction, i.e., 1 showing phasic EUS-EMG activity (bursts and pauses) and high-frequency oscillations of IVP. Phasic duration (Pd) is the time during which periodic burst and pauses of EUS-EMG activity occur (phase 2). For IVP-EMG plots, mean rectified EUS-EMG activity was measured for each 2-mm-wide span around every multiple of 5 mmHg of IVP during phases 1 and 4. Approximations of such spans for multiples of 10 mmHg of IVP are indicated by gray shading. For nonvoiding contractions (NVCs) and nonphasic voiding contractions (npVCs), the rising and falling phases of IVP are considered to be phases 1 and 4 even though there is no phase 2 or 3.

