Fig. 3.
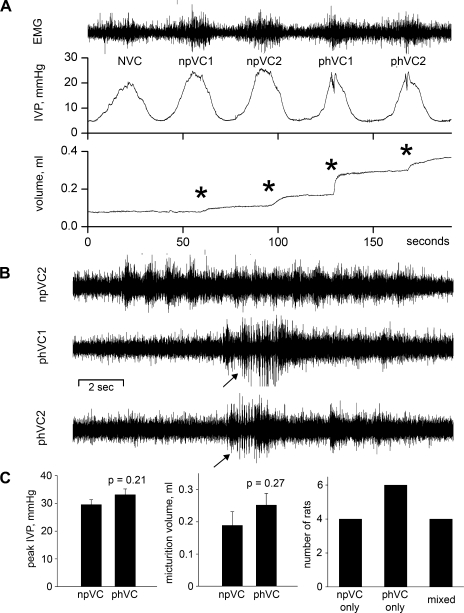
NVCs, npVCs, and phasic voiding contractions (phVC) in an SCI rat. A: EUS-EMG activity, IVP, and micturition volume for the 3 types of contractions. *Onsets of detection of voiding. B: comparison of EUS-EMG activities for the 17 s centered around the peaks of the micturition contractions for the second npVC (npVC2) and the 2 phVCs (phVC1, phVC2). Arrows mark beginning of phasic EUS-EMG activity. C: two left-hand plots show that neither peak IVP nor micturition volume differ significantly between npVCs and phVCs. Right: plot shows the distribution of npVCs and phVCs among the 14 SCI rats; for the 4 rats with a mixture of npVCs and phVCs, a mean of 64.5% of all voiding contractions were phVCs (range 43.5–85.7%).

