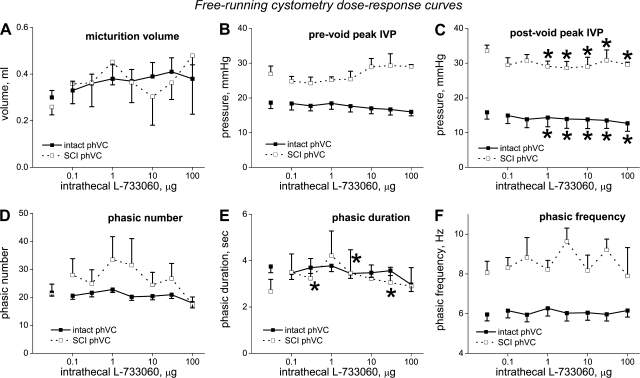
Fig. 7.
Free-running cystometry dose-response curves for effects of intrathecal L-733060 on phVCs in intact and SCI rats. Separate values at left, which are not connected to other points, are vehicle values; bars indicate SEs. *Statistically significant differences for a given contraction type between the marked response and vehicle; other statistical information is presented in the text.

