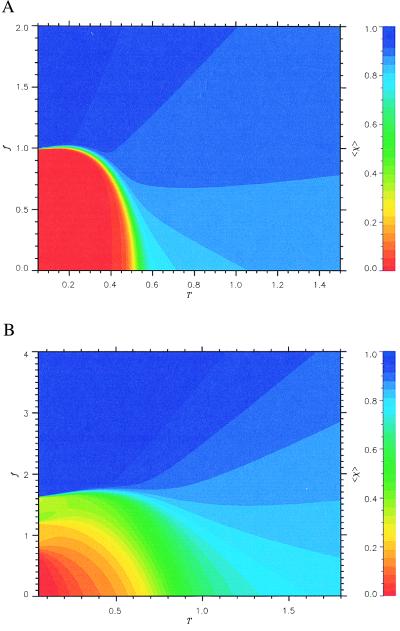
Figure 1.
Phase diagrams in the (f, T) plane for (a) the 36-mer two-state KGS sequence and (b) 27-mer moderate folding RB sequence. The color code for <χ(f, T)> is given on the right. The red color corresponds to the states in the NBA, whereas the blue color indicates the unfolded states. Green areas correspond to intermediate partially folded states. For both the sequences the boundary of NBA is given by Eq. 4.

