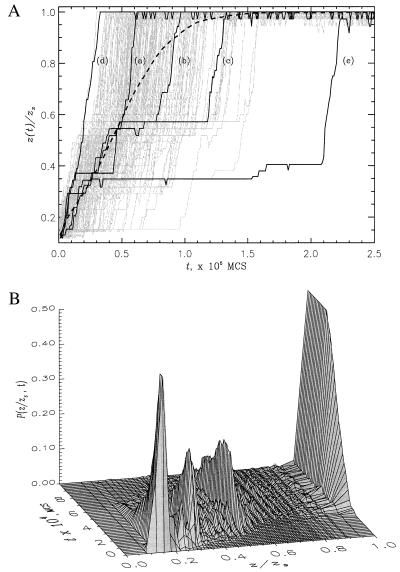
Figure 2.
(a) The time dependence of extension z(t)/zs for 201 individual trajectories of 36-mer sequence at Ts = 0.49 and fs = 4.0. Three generic trajectories [curves (a)−(c)], the fastest (d), and the slowest (e) trajectories are shown in black. The rest are given in grey. The average <z(t)> obtained from 400 individual trajectories is represented by a thick dashed curve. (b) The probability distribution P(z/zs, t) for 36-mer sequence under the same unfolding conditions as in Fig. 2a. P(z/zs, t) gives the kinetic probability of occurrence of the extension value z at the time t. In both plots the extension values are normalized by zs = N − 1.

