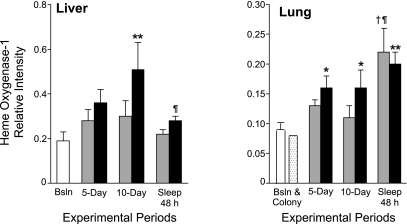
Fig. 3.
Liver (left) and lung (right) heme oxygenase-1 content during sleep loss and sleep recovery. Data are expressed as the chemiluminescence intensity of the specimen relative to a standard. Data from baseline controls (open bar) included n = 8 for the liver and n = 5 for the lung, the latter of which was combined with data from colony controls (n = 2; stippled bar) to increase the degrees of freedom for statistical tests These data are shown relative to those from yoked (shaded bars) and sleep-deprived animals (solid bars) during 5 and 10 days of sleep deprivation and during 2 days of recovery sleep subsequent to 10 days of sleep deprivation. Values are expressed as means ± SE; n = 5 or 6 per yoked or sleep-deprived group at each time point. P < .016 for the comparison with *baseline+colony, or †day 5 or ¶day 10 of the same group. P < .001 for the comparison with **baseline or baseline+colony.

