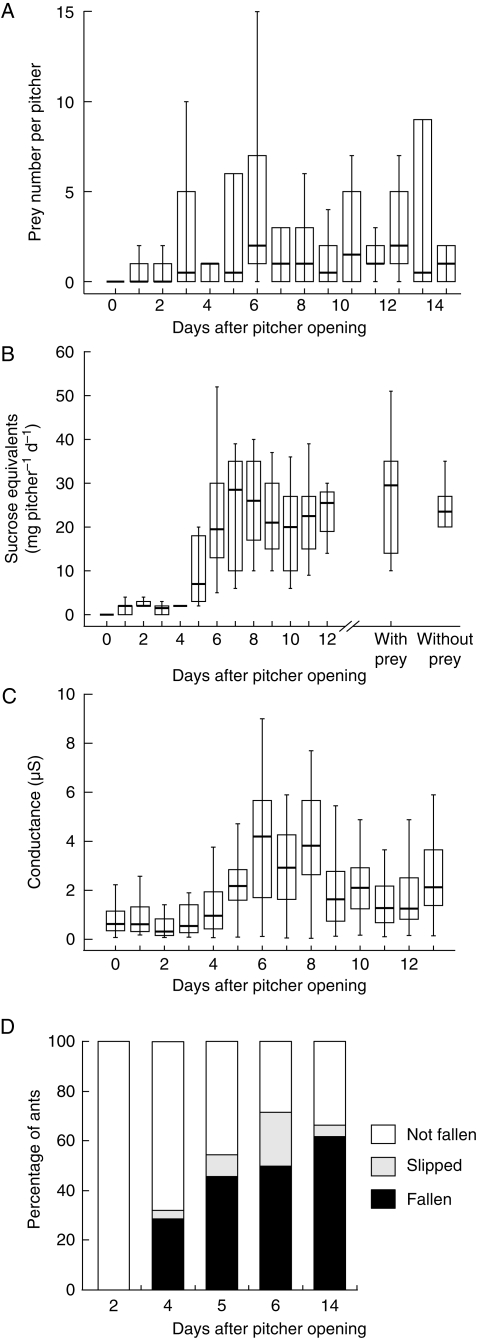
Fig. 2.
Age-dependent changes of (A) natural prey capture (n = 10 pitchers); (B) peristome nectar secretion (n = 10 pitchers) – the two box-whiskers on the right show the nectar production of prey-deprived pitchers and of pitchers ‘fed’ with ants (n = 10 pitchers each, 13 d old); (C) peristome wetness (as measured by its electrical conductance), recorded daily at a given intermediate air humidity (n = 30 pitchers, cf. Materials and Methods); and (D) capture efficiency as obtained in running experiments with ants on a single pitcher. Bars represent medians, boxes the inner quartiles and whiskers all data within the 95 % confidence interval.

